Quick answer
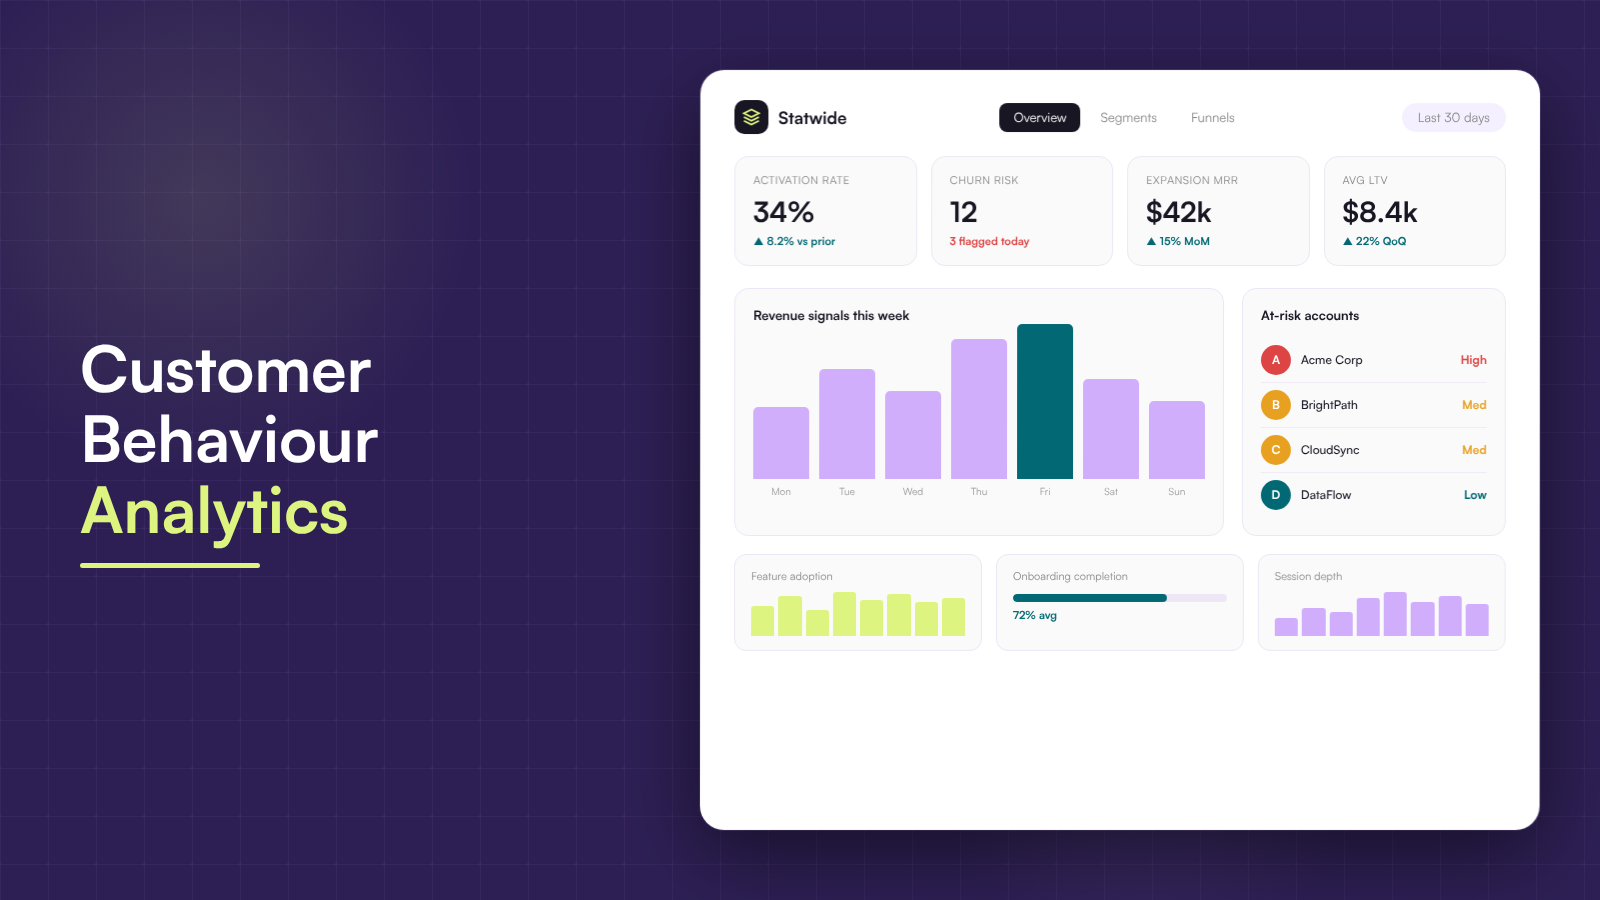
Customer behavior analytics is the practice of collecting, analyzing, and acting on user actions inside your product to predict revenue outcomes. It connects behavioral signals (feature adoption, workflow completion, engagement patterns) to business results like churn risk, expansion revenue, and lifetime value. Unlike basic web analytics, customer behavior analytics tells revenue teams which users are heading toward an upgrade, and which are about to leave.
Key takeaways
- Companies using advanced customer analytics are 23x more likely to outperform on customer acquisition (McKinsey)
- AI-powered behavioral analysis can detect churn signals 4 to 6 weeks before cancellation
- Connecting behavioral data to revenue outcomes turns analytics from a reporting tool into a growth engine
- Account-level behavioral intelligence reveals expansion opportunities hiding in usage patterns
Your SaaS product generates thousands of behavioral signals every day. Users click, scroll, skip onboarding steps, hit errors, complete workflows, and abandon features. Most teams collect all of it. Fewer than 25% connect any of it to revenue outcomes (Salesforce State of Marketing, 2024).
That gap is where money disappears. A dashboard showing 10,000 monthly active users looks healthy until you realize 60% of them stopped using your core feature two weeks ago. DAU/MAU averages about 13% across SaaS, but that number hides whether the users who matter (the ones driving upgrades and renewals) are actually engaged.
Customer behavior analytics closes that gap. It takes raw behavioral data and maps it to the outcomes revenue teams care about: activation, retention, expansion, and churn. Companies using advanced customer analytics are 23x more likely to outperform competitors on customer acquisition (McKinsey Next in Personalization Report). Not because they have more data, but because they know which data predicts revenue.
This guide walks through a practical framework for turning behavioral signals into revenue intelligence, from identifying the right signals to building AI-powered predictions that catch churn before it happens.
What is customer behavior analytics (and why revenue teams care)
Customer behavior analytics tracks what users do inside your product and connects those actions to business outcomes. It goes beyond pageviews and session counts to measure feature adoption, workflow completion, engagement depth, and the behavioral patterns that predict whether someone will upgrade, renew, or leave.
The distinction matters. Basic web analytics tells you 5,000 people visited your pricing page. Behavioral analytics tells you which features those visitors used before they landed there. Customer behavior analytics tells you which of those behavioral patterns actually lead to purchases, and at what rate.
Three layers of analytics, three different questions answered:
| Layer | Question it answers | Example |
|---|---|---|
| Web analytics | Where did users come from? | 40% of pricing page visits from organic search |
| Behavioral analytics | What did users do? | Users who created 3+ dashboards visited pricing 2.5x more often |
| Customer behavior analytics This guide | What does that behavior mean for revenue? | “3+ dashboards in week one” cohort converts at 34%, vs. 8% for the rest |
The revenue connection is what separates customer behavior analytics from its cousins. When your customer intelligence platform ties event data to revenue events, every team works from the same behavioral truth. Product sees which features drive retention. Marketing sees which acquisition channels bring users who activate. RevOps sees churn risk before it shows up in a renewal conversation.

Statwide’s Events module captures these signals at the interaction level, then connects them to revenue outcomes through Funnels, Path Analysis, and AI Sense, so the insight lives in one place instead of scattered across five tools.
The behavior-to-revenue framework
Knowing that behavioral data matters is one thing. Turning it into revenue intelligence is another. This framework breaks the process into two steps: mapping the right signals, and identifying the in-product behaviors that predict outcomes.
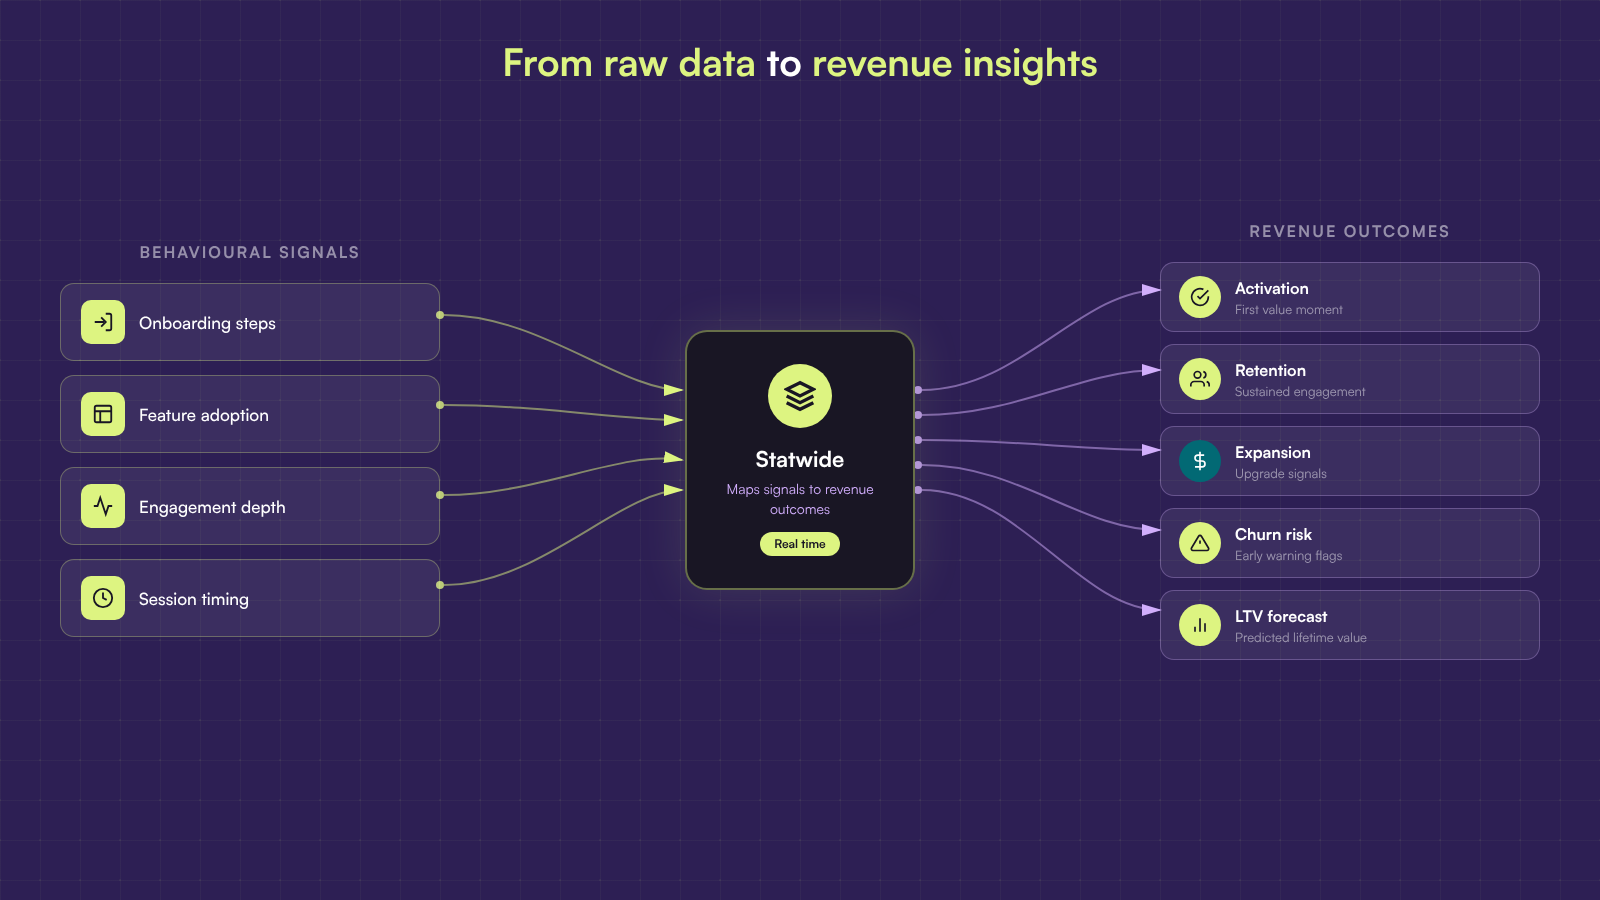
Map behavioral signals to revenue outcomes
Most teams track hundreds of events but connect very few to revenue. The fix is working backward from the outcome you care about, then finding the behavioral signals that predict it.
Start with three revenue outcomes: activation (first value moment), retention (continued engagement), and expansion (upgrade or upsell). For each, identify the behavioral signals that separate users who reach that outcome from those who don’t.
| Revenue outcome | Behavioral signal | Why it matters |
|---|---|---|
| Activation | Completed onboarding + used core feature in first 3 days | Users who hit the value moment early convert at 3 to 4x higher rates |
| Retention | Weekly return to 2+ features, workflow completion rate above 60% | Sustained multi-feature usage predicts 90-day retention better than login frequency |
| Expansion | Hit usage limits, invited team members, used advanced features | These behaviors signal the user has outgrown their current plan |
Statwide’s Path Analysis lets you visualize the actual journeys users take toward each revenue moment, so you can spot which paths lead to upgrades and which lead to drop-off.

Behavioral signals that predict action
The real power of customer behavior analytics shows up when you look at in-product signals that predict what a user will do next. These are not abstract segments. They are concrete actions (or inactions) that correlate with revenue outcomes.
Consider what happens inside the product itself. A user who skips the onboarding tour is more likely to never purchase a subscription. A user who hits errors repeatedly during their first session is unlikely to come back for a second try. These behavioral signals are more predictive than any demographic segment or traffic source breakdown.
Build a signal map for your product:
- Negative signals: Skipped onboarding, repeated errors, single-feature usage, declining session frequency, abandoned workflows
- Positive signals: Multi-feature adoption, team invitations, API integration setup, hitting usage ceilings, creating custom configurations
- Timing signals: Speed to first value moment, gaps between sessions, recency of last engagement with core features
The behavioral insight here is not about grouping users into neat categories. It is about watching the specific actions that tell you whether someone is moving toward value or drifting away from it. When Statwide’s Events module tracks these signals in real time, your team can act on them before the outcome is decided.
How AI-powered churn prediction changes the math
Here is the revenue case for AI in customer behavior analytics: a 5% increase in customer retention produces 25% to 95% more profit (Bain & Company). Yet most teams still rely on lagging indicators like NPS surveys and support ticket volume to predict churn. By the time those signals fire, the decision to leave is already made.
AI-powered behavioral analysis changes the timeline. Instead of reacting to churn, it detects the early behavioral patterns that precede it. Gartner projects that by 2026, organizations using AI for customer analytics will see 15% to 20% improvement in retention metrics. The advantage comes from pattern recognition at a scale humans cannot match.
What AI sees that dashboards miss:
- Micro-disengagement patterns: A user logging in but spending 40% less time in core features over two weeks. No single session looks alarming. The trend is invisible without AI.
- Feature abandonment sequences: Users who stop using a specific feature in a specific order tend to churn within 45 days. AI identifies the sequence; a dashboard shows only the average.
- Anomaly clusters: When three users on the same account all reduce activity in the same week, AI flags it as an account-level risk even though each individual’s usage looks normal.

Statwide’s AI Sense module runs this analysis continuously. It watches behavioral patterns across your entire user base, flags anomalies, and surfaces risk scores that update in real time. The output is not a report you check on Fridays. It is a signal your CS team can act on the moment it appears.
The shift from descriptive to predictive analytics is not incremental. When you catch churn risk a month early instead of a week late, the intervention options multiply: a personalized onboarding nudge, a proactive support outreach, a feature walkthrough. Each one is cheaper and more effective than a discount offer after the cancellation email lands.
Account-level behavioral intelligence
Individual user analytics tell part of the story. In B2B SaaS, revenue decisions happen at the account level, and account health depends on the collective behavior of every user on that account.
Health scores that actually predict outcomes
Traditional health scores weight support tickets and login frequency. They describe the present but fail to predict the future. A healthy-looking account where power users have quietly stopped using advanced features is a churn risk that traditional scores miss entirely.
Behavioral health scores work differently. They weight feature depth, workflow completion, collaboration patterns, and engagement trends over time. The result is a score that predicts churn 4 to 6 weeks earlier than ticket-based models.
| Health score input | Traditional approach | Behavioral approach |
|---|---|---|
| Engagement | Login count per week | Feature depth and workflow completion rate |
| Sentiment | NPS survey response | In-app behavior patterns after feature releases |
| Growth | Seat count | Team collaboration events and cross-feature adoption |
| Risk | Support ticket volume | Declining engagement velocity across key features |

Statwide’s Accounts module aggregates individual user behaviors into account-level intelligence, and Health Scores turn those aggregations into actionable risk and opportunity signals.
Expansion revenue signals hiding in usage data
Upsell and cross-sell opportunities leave behavioral fingerprints long before a customer asks for a bigger plan. The trick is knowing which patterns to watch.
For power users, the signal can be straightforward. A user who burns through 90% of their credit allocation in 30% of their subscription tenure is ready for an expansion conversation. That single usage pattern is a trigger for your sales team to reach out with an upgrade offer, not a renewal check-in.
Beyond individual triggers, build a monitoring practice around your highest-value accounts. Maintain a list of pro, premium, and enterprise users and actively check whether they are hitting errors, facing performance issues, or encountering feature limits. These users generate disproportionate revenue. If they experience friction, the cost of inaction is highest.
Expansion signals to track:
- Usage ceiling: Hitting plan limits on API calls, storage, seats, or credits
- Feature exploration: Accessing features outside their current plan (viewing premium feature pages, attempting locked actions)
- Team growth: Adding new users, creating team workspaces, setting up role-based permissions
- Integration activity: Connecting third-party tools, using webhooks, setting up data exports
Statwide’s Revenue Analytics surfaces these signals by connecting conversion tracking data to account-level usage patterns, so expansion opportunities don’t hide in spreadsheets.
From raw data to revenue insights: getting started
You don’t need a data science team or a six-month implementation to start connecting behavioral data to revenue. Here is a practical path that works for teams of any size.
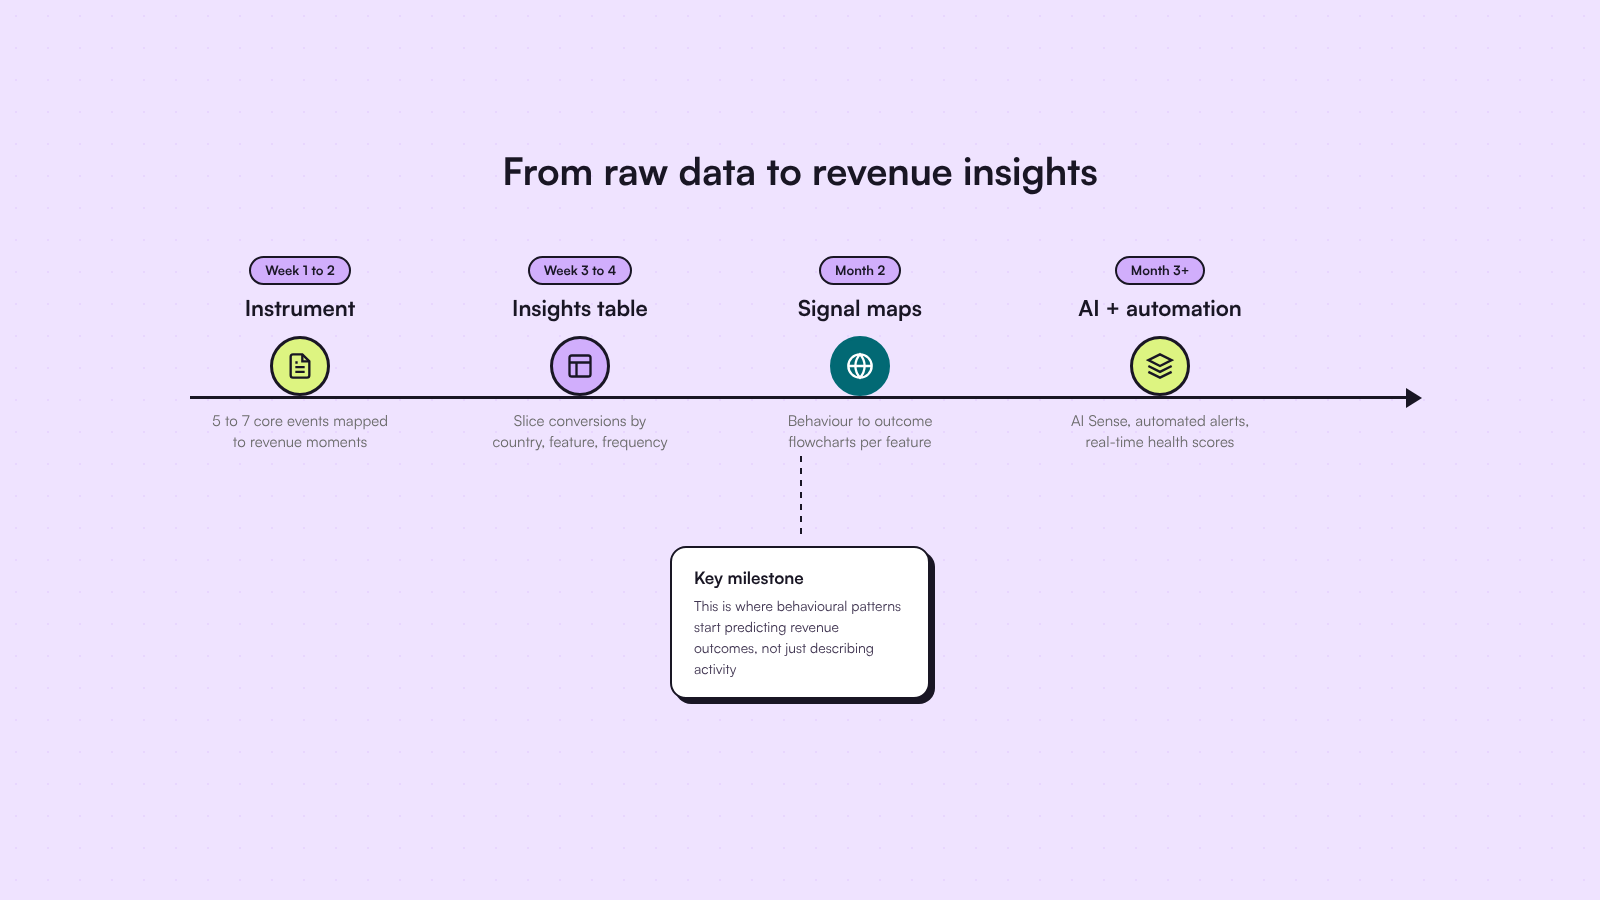
Phase 1 (Week 1 to 2): Instrument your core events. Start with 5 to 7 behavioral events that map to your key revenue moments. For most SaaS products, that means: signup completed, onboarding finished, core feature used, secondary feature explored, collaboration action taken, upgrade page viewed, and error encountered. Statwide’s Events module lets you set these up without engineering bottlenecks.
Phase 2 (Week 3 to 4): Build your first insights table. Take your conversion events and create a breakdown table. Slice conversions by country, feature used, number of credits consumed, product type, and frequency of use. As you break down the data, patterns emerge: maybe users in one region convert at 2x the rate, or users of a specific feature set churn 40% less.
Phase 3 (Month 2): Create signal-to-outcome maps. For each product area or feature, build a separate insights table and a simple flowchart showing the behavioral path from first use to revenue event. This is where you start seeing which behaviors actually predict outcomes versus which ones just correlate with activity.
Phase 4 (Month 3+): Layer in AI and automation. Once your behavioral foundation is solid, connect AI Sense to surface patterns you would never find manually. Set up automated alerts for churn risk signals and expansion opportunities. Build Health Scores that update in real time based on behavioral inputs, not quarterly survey results.

The teams that get the most from customer behavior analytics are not the ones with the most data. They are the ones who connect the right behavioral signals to revenue outcomes early, learn from the patterns, and iterate. Product analytics gives you the events. User behavior segmentation groups them into meaningful patterns. Customer behavior analytics ties it all to the number that matters: revenue.
Frequently asked questions
What is customer behavior analytics?
Customer behavior analytics is the practice of tracking and analyzing user actions inside a product to predict revenue outcomes. It goes beyond basic metrics like pageviews or session counts to measure feature adoption, workflow completion, and engagement patterns, then connects those behaviors to activation, retention, expansion, and churn. Tools like Statwide combine event tracking, cohort analysis, and AI-powered health scores into a single intelligence layer.
How does customer behavior analytics improve revenue?
It shifts analytics from reporting what happened to predicting what will happen. Companies using advanced customer analytics are 23x more likely to outperform on customer acquisition (McKinsey). By identifying which behavioral patterns lead to upgrades, renewals, and churn, teams can intervene earlier, allocate resources to high-value accounts, and stop revenue leaks before they show up in quarterly reports.
What data do you need for customer behavior analytics?
You need event-level data: clicks, feature usage, workflow completions, errors encountered, and session patterns. Layer in transactional data (plan type, billing events, upgrade/downgrade history) and support interactions for a complete picture. Statwide’s Events module captures behavioral data at the interaction level without requiring manual instrumentation for every action.
Can customer behavior analytics predict churn?
Yes. AI-powered customer behavior analytics can detect churn signals 4 to 6 weeks before cancellation by identifying micro-disengagement patterns, feature abandonment sequences, and anomaly clusters that humans cannot spot in dashboards. Gartner projects 15% to 20% retention improvement for organizations using AI-driven customer analytics by 2026.
What is the difference between customer behavior analytics and behavioral analytics?
Behavioral analytics (covered in depth in our behavioral analytics guide) focuses on understanding what users do: clicks, navigation paths, feature usage. Customer behavior analytics adds the revenue layer, connecting those behaviors to business outcomes like lifetime value, churn probability, and expansion readiness. Behavioral analytics is the input. Customer behavior analytics is the output that revenue teams act on.
How does AI improve customer behavior analytics?
AI adds three capabilities that manual analysis cannot match: anomaly detection (spotting unusual behavioral patterns across millions of data points), predictive scoring (calculating churn risk and expansion probability for every account), and automated segmentation (grouping users by behavioral patterns that predict outcomes). Statwide’s AI Sense module runs these analyses continuously, surfacing signals your team can act on in real time.