Quick answer
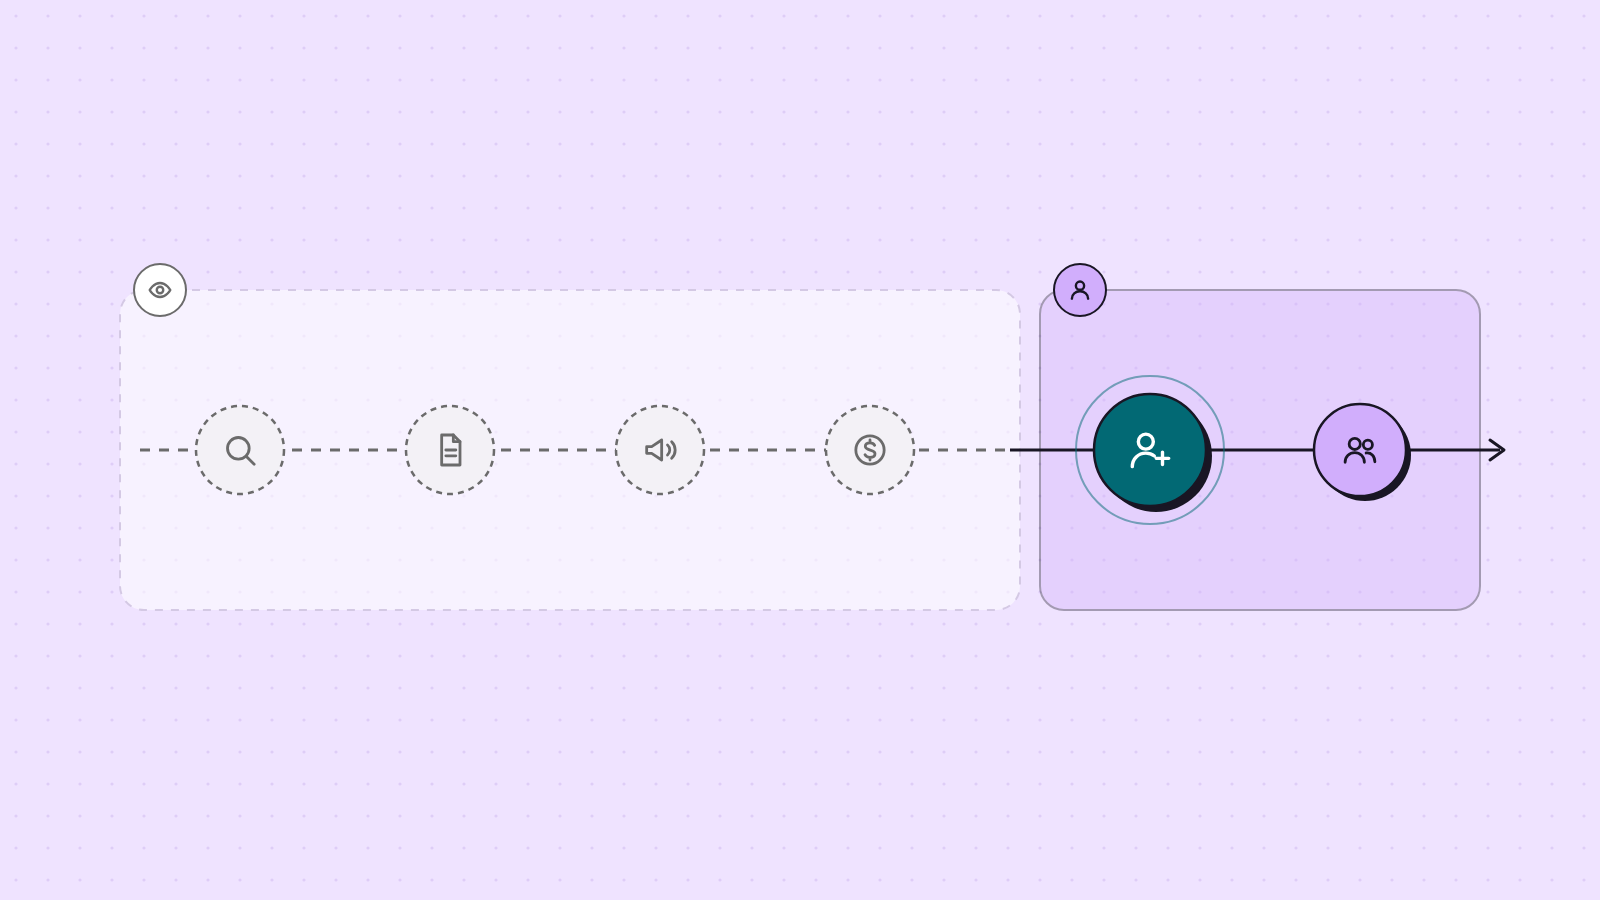
A user journey is the full path a person takes with your product, from the first anonymous visit to becoming an active, paying customer. It usually runs through five stages: awareness, consideration, conversion, retention and advocacy. In SaaS, a large part of that path happens before signup, while you still don’t know who the visitor is.
Key takeaways
- A user journey runs through five stages: awareness, consideration, conversion, retention and advocacy.
- In SaaS, most of the journey happens before signup, while the visitor is still anonymous.
- Calling identify() at signup or login links earlier anonymous visits to the known user.
- Give each stage a signal you can measure, and check your journey map against real path data.
A new trial signup lands in your CRM with the source marked “direct.” Nobody on the team knows where they came from. In reality, that person found you through a Google search two weeks ago, read two blog posts, came back from a LinkedIn ad and checked the pricing page twice before creating an account. Your analytics holds all of it as five anonymous sessions that were never tied to their name.
That gap is where most user journey work falls apart. Teams map the stages on a whiteboard, then measure only the part that starts at signup. This guide covers what a user journey is, the stages and touchpoints it’s made of, and how to connect the anonymous chapter to the known user so the whole path sits in one place. That last part is the problem Statwide was built to solve.
What is a user journey?
A user journey is every step a person takes with a product, from the moment they first hear about it to the point where they use it regularly and pay for it. Think about ordering dinner through a delivery app. You see an ad, browse a few restaurants, add items, check out, track the rider and maybe leave a rating. Each of those steps is part of your journey with that app, including the ones that happened before you opened it.
In SaaS, the journey stretches across your website, your product and everything around them, like support chats and onboarding emails. It also stretches across time. A B2B buyer might visit five times over three weeks before signing up, then take another two weeks to invite a teammate. Treating each visit as a separate event hides the one thing you want to know: which steps lead to a paying customer.

User journey vs customer journey vs user flow
These three terms get mixed up all the time. They describe different scopes, and the easiest way to see the difference is to follow one person through all three.
| User journey | Customer journey | User flow | |
|---|---|---|---|
| What it covers | Every step one person takes with one product, from first visit to regular use | Every touch a person has with the brand, including ads, sales calls, support and renewals | The screens and clicks needed to finish one task inside the product |
| Time span | Days to months | The whole relationship, often years | Seconds to minutes |
| Who usually owns it | Product and growth teams | Marketing, CX and leadership | Product designers |
| Example: one Canva user | Finds a template on Google, returns from an ad, signs up, invites a teammate, upgrades to a team plan | All of that plus newsletters, a support ticket and a renewal email | The four screens of the signup form |
You’ll also hear about user stories in product teams. A user story is a requirement written from the user’s point of view (“as a marketer, I want to schedule posts so I can plan my week”), so it describes a need, while a journey describes a path. If you want the bigger picture of how journeys fit into the full relationship, our guide on customer lifecycle vs customer journey breaks it down.
The 5 stages of a user journey (and what they look like in SaaS)
Most guides describe the user journey in five stages, and they hold up well for SaaS with one change. Each stage needs a signal you can measure, otherwise the map stays a guess. Here is how the classic stages line up with a SaaS product.
| Stage | SaaS version | What the user does | Signal to track | Where to see it in Statwide |
|---|---|---|---|---|
| Awareness | Quality traffic | Finds you through search, an ad or a review site | Source, landing page, return visits | Web Analytics |
| Consideration | Quality traffic | Reads pricing and docs, compares options | Pricing page views, docs depth | Path Analysis |
| Conversion | Meaningful activation | Signs up and reaches first value | Activation event, time to value | Funnels |
| Retention | Deep adoption | Uses core features every week | Feature adoption, usage drift | Cohorts, AI Sense |
| Advocacy | Expansion signals and retained revenue | Invites the team, upgrades, refers others | Seats added, upgrade intent | Accounts |
Look at where the first two stages sit. Awareness and consideration happen almost entirely before signup, so in most analytics setups they belong to a visitor with no name. Marketing sees the traffic, product sees the account, and the handoff in the middle is where the story breaks. The anonymous chapter section below goes into why.
Conversion is the stage teams watch most closely. Across more than 500 products, the average activation rate for SaaS was 36%, with a median of 30% (Lenny’s Newsletter). Most people who sign up never reach the moment where the product proves its value, and a clear stage model shows you which step loses them.
Retention and advocacy are where the journey turns into revenue. In B2B SaaS, advocacy usually looks like expansion: a user invites teammates, the account adds seats, or a team moves to a bigger plan. Those signals belong to the account as much as the person, which is why B2B journey tracking needs both views.
Touchpoints: where the journey actually happens
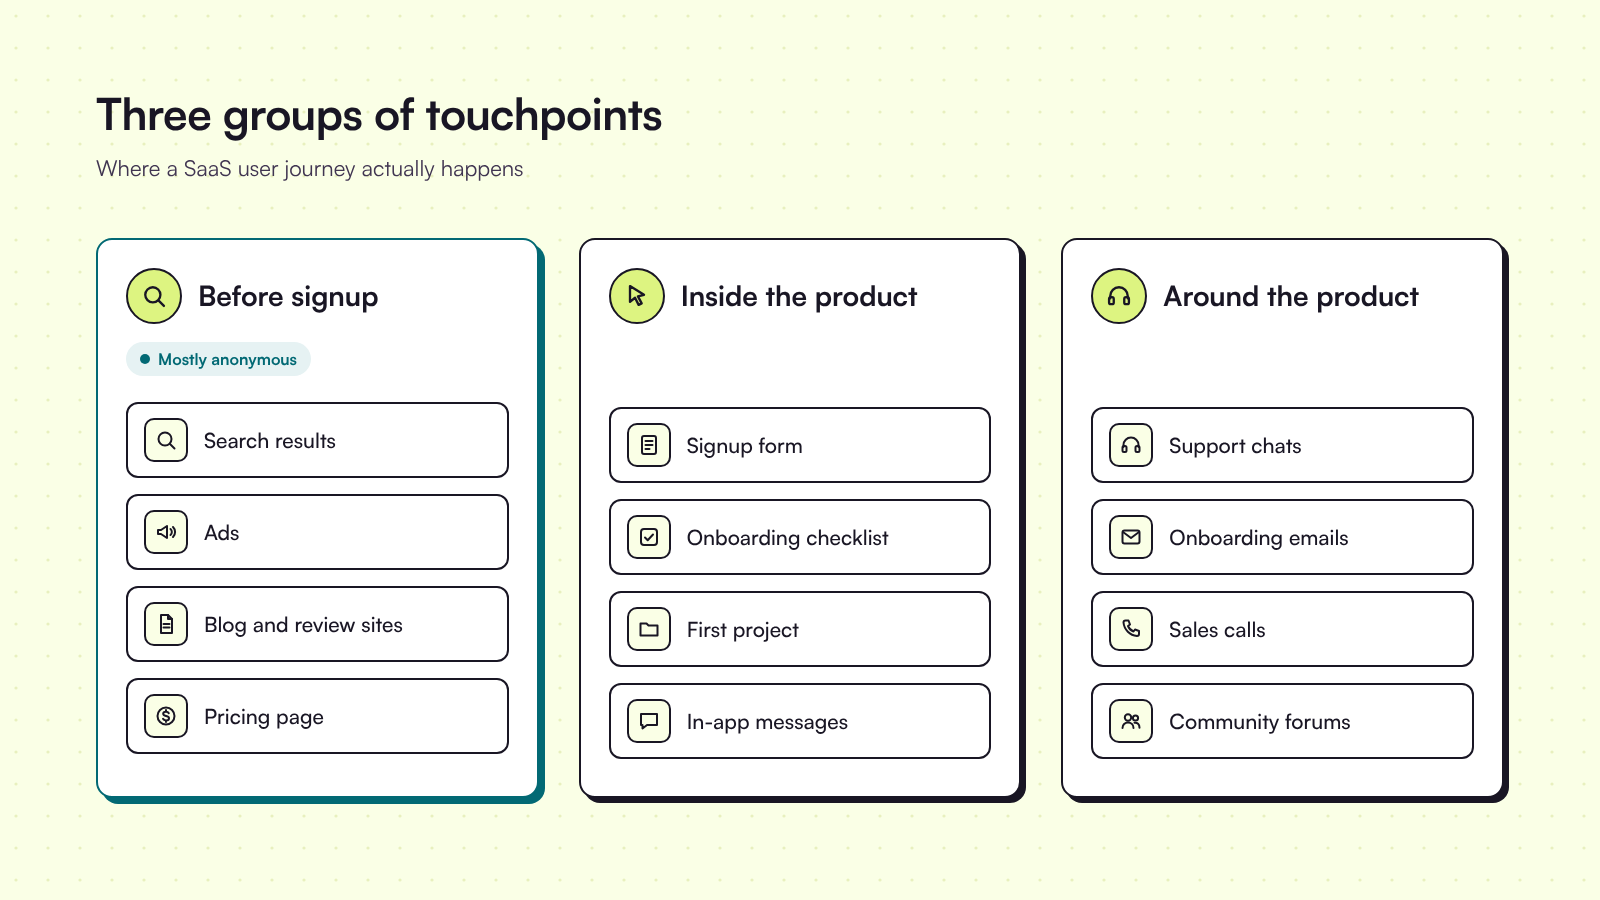
A touchpoint is any moment where a person interacts with your company. In SaaS they fall into three groups, and most teams measure only one of them well.
- Before signup: search results, ads, blog posts, review sites, comparison pages, the pricing page and demo videos.
- Inside the product: the signup form, the onboarding checklist, the first project, feature discovery and in-app messages.
- Around the product: support chats, onboarding and billing emails, sales calls and community forums.
A website user journey usually runs from a landing page reached through search or an ad, through one or two content pages and the pricing page, to signup. Each step builds trust or adds doubt. B2B buyers lean on the site more than ever: 67% say they prefer a buying experience without a sales rep (Gartner), and 69% notice gaps between what a vendor’s website says and what its sellers tell them (Gartner). When your touchpoints tell different stories, buyers notice.

Take a project management tool whose best traffic comes from paid search and high-intent organic queries like “project tracker for agencies.” Those visitors already know what they want. Every extra step between landing and the aha moment, here the first project created with a teammate, costs signups: a long form, a forced demo call, an empty workspace. Shorten that road for paid and high-intent organic traffic first. Once people reach value fast, onboarding, retention and expansion all get easier to improve.
The anonymous chapter: why most of the journey happens before signup
Until someone signs up or logs in, they’re an anonymous visitor. Your analytics knows a browser and a session, but not a person. For most SaaS products that covers the whole awareness and consideration stage, which can mean weeks of research.
The first problem is that the tools split the story. Web analytics owns the visits before signup, product analytics owns everything after, and each tool has its own idea of who the user is. When someone signs up, the history from the first tool rarely follows them into the second.
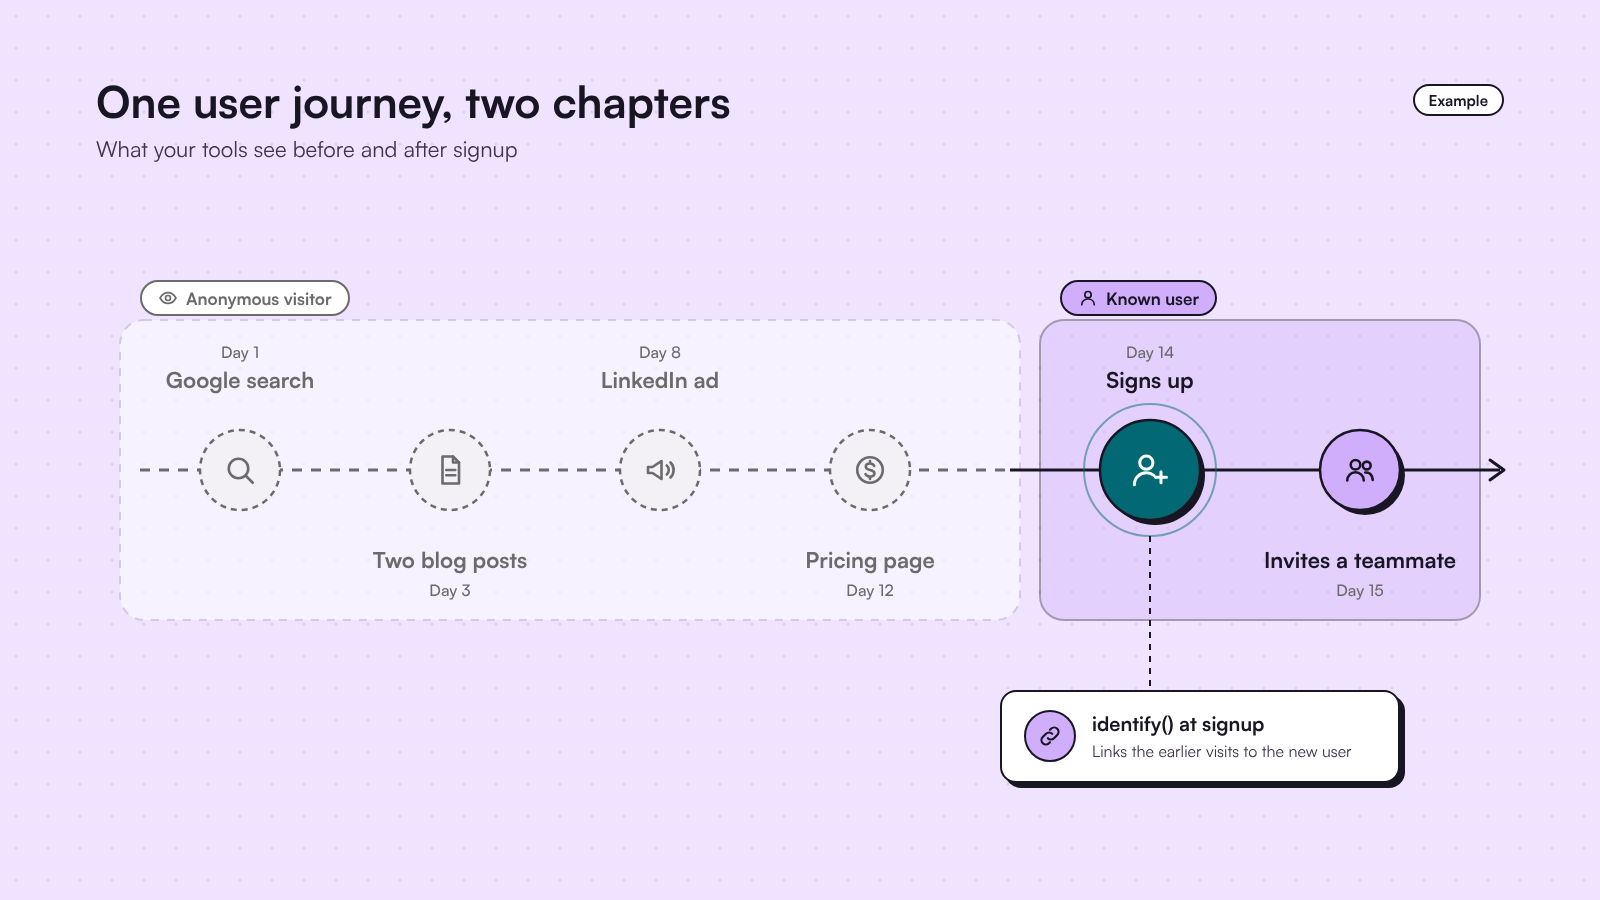
The data also has holes. Cookie banners let visitors opt out, and a 2024 study of consent banners found that more than 60% of users declined tracking when a one-click “reject all” button was offered (Jha et al.). Part of the early journey will always be missing, which makes the part you can capture worth more.
B2B adds another layer because buying is a group decision. Forrester found that an average of 13 people take part in a B2B purchase, and 89% of purchases involve two or more departments (Forrester). Several of those people will research you on their own before one of them signs up.
The cost shows up in everyday decisions. Attribution stops at signup, so the channels that start journeys look weaker than they are. Activation reports fill up with users who seem to come from nowhere. Marketing and product argue over numbers pulled from different tools. Only 14% of organizations say they have a 360-degree view of the customer (Gartner), and the anonymous chapter is a big part of the reason.
How to connect anonymous and known activity
You don’t need a data warehouse project to close this gap. The method has three steps, and in Statwide it works like this.
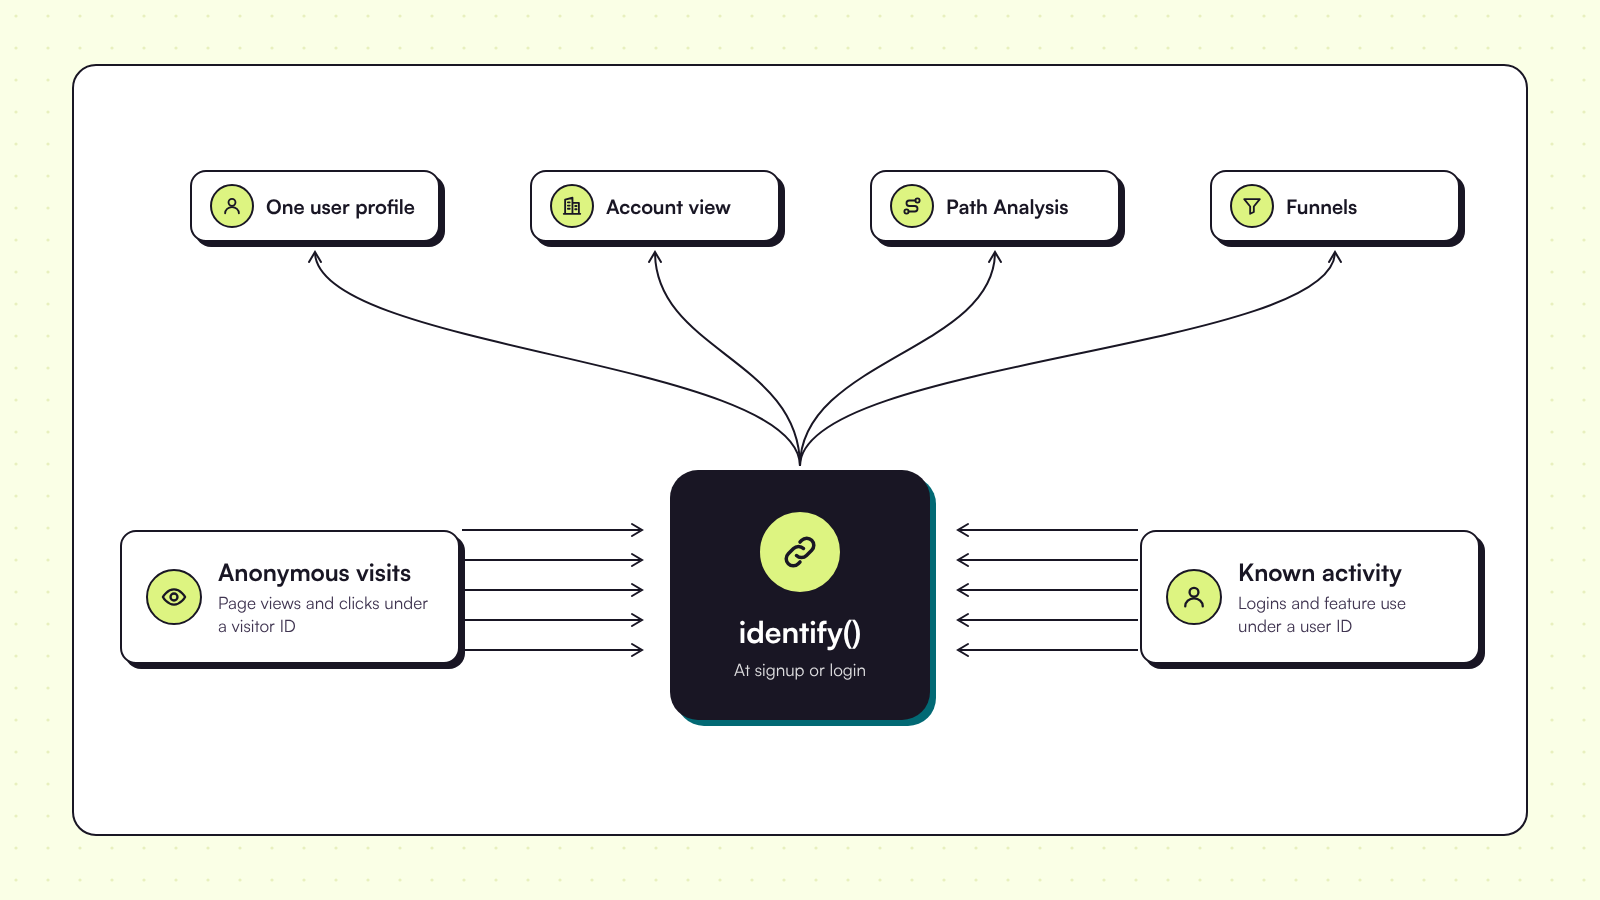
- Track every visit from the first page view. Add the installation code to your website and product so page views and clicks are captured automatically, before anyone logs in. Each visitor gets an anonymous visitor ID.
- Identify the user at signup or login. Call identify() when someone creates an account or logs in. Statwide then links their earlier anonymous events to the known user, so last week’s blog visits and pricing page views show up on the same profile. Call reset() on logout so two people sharing a computer don’t get merged.
- Roll users up to accounts. In B2B the buyer is a team. Accounts groups users by company, so the people researching your product read as one account journey instead of a dozen strangers.

This is where journey data starts to pay off. In one Statwide analysis of 42,381 sessions, 78% of users dropped between signup and activation, and session recordings showed them hesitating on onboarding step 2 because the value copy was unclear. In a separate Statwide case, fixing onboarding friction lifted activation from 12% to 28%.
How to track and analyze the user journey
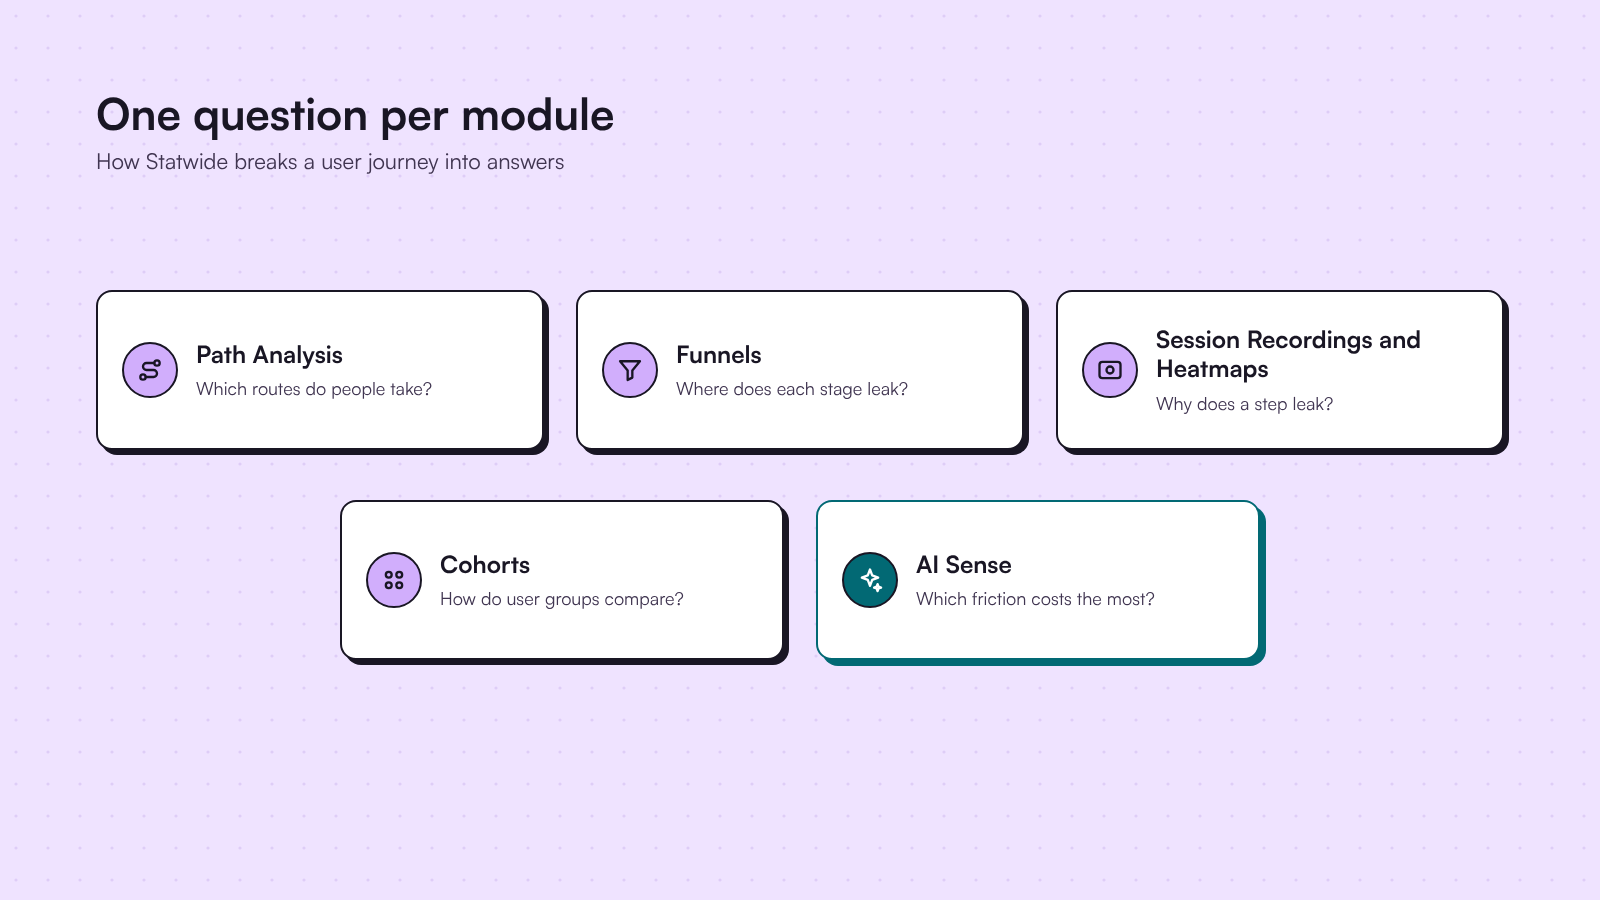
Once anonymous and known activity sit on one profile, user journey analytics becomes practical. Each Statwide module answers a different question.
- Path Analysis shows the routes people actually take, from the first landing page to signup and beyond, including loops and dead ends nobody designed.
- Funnels show where each stage leaks, for example how many visitors who view pricing go on to start a trial.
- Session Recordings and Heatmaps show why a step leaks, such as rage clicks, ignored buttons or a form field where people stop.
- Cohorts group users by behavior, so you can compare people who came from paid search with people who came from organic content.
- AI Sense ranks friction by its impact on conversion and suggests the next best action.
Expect the real paths to look different from the journey you designed. Researchers now treat that gap as something you can measure: a 2026 study in Scientific Reports models digital customer journeys to detect “gaps between planned journeys and actual journeys reflected by the data logs,” scoring the steps users skip, miss or reorder (Bar-El et al.). You don’t need a statistical model to start. Write down your intended path, compare it with the three most common real paths in Path Analysis, and look at where they split.
For more on the behavior side, our guide to behavioral analytics covers the methods, and user flow analysis walks through analyzing a single path inside the product.
User journey mapping, in short
A user journey map is a visual of the journey for one persona: the stages, what the person does and thinks at each one, the touchpoints involved, where they get stuck and what you could improve. Most teams build the first version in a workshop, which is a good start. The map gets far more useful once you check it against real path data. Replace guesses about where people drop with the numbers from your funnels, and add the routes users take that nobody drew. Treat the map as a hypothesis, and update it whenever the product or your traffic mix changes. User journey mapping works best as a habit you repeat every quarter.
Why the full user journey matters
Averages hide the problems a journey view exposes. Say your overall signup-to-paid conversion is 5%. The number looks fine until you split it by channel. Here is an illustrative example.
| Channel | Share of signups | Signup to paid | What it tells you |
|---|---|---|---|
| Paid search and social | 50% | ~2% | Expensive traffic that rarely converts, so check targeting and landing pages |
| Organic search | 30% | ~10% | High intent, so invest in more content and keep the path short |
| Direct and referral | 20% | ~5% | Mixed intent, so look at which pages they land on |
| Blended | 100% | ~5% | Looks healthy and hides all of the above |
The same blended number can hide country and page problems too. Signups from one country might drop because the payment gateway rejects local cards. A landing page with no social proof or product examples might convert at half the rate of the rest of the site. Both problems show up before signup, in the anonymous part of the journey, so that data is what lets you fix the top of the funnel and shape the site and product around how people actually buy.
The payoff is measurable. McKinsey research found that improving customer journeys can lift revenue by 10 to 15% while cutting the cost to serve by 15 to 20% (McKinsey). Most teams already own some journey tooling: 65% of senior marketing leaders have adopted customer journey analytics tools, yet they use only 43% of the available capabilities (Gartner).
If you want to see every user journey from the first anonymous click to revenue in one place, Statwide’s customer intelligence platform connects web and product analytics on one profile. Book a demo and bring your leakiest funnel.
Frequently asked questions
What is a user journey?
A user journey is the full path a person takes with a product, from the first visit to becoming an active, paying customer. It covers every touchpoint along the way, including website visits, signup, onboarding, feature use and support. In SaaS, the early part of the journey usually happens before the person signs up, so it’s anonymous unless you connect it to their account later.
What are the 5 stages of a user journey?
The five stages are awareness, consideration, conversion, retention and advocacy. In SaaS they map to quality traffic, research on pricing and docs, signup and activation, regular feature adoption, and expansion through invites, upgrades and referrals. Each stage should have a signal you can measure, such as return visits, pricing page views, an activation event or seats added.
What is the difference between a user journey and a user flow?
A user journey covers every step one person takes with a product over days or months, across the website, the product and support. A user flow covers the screens and clicks needed to finish one task inside the product, such as completing the signup form. Journeys show where people drop between stages, and flows show where they get stuck within a single task.
What is the difference between a user journey and a customer journey?
A user journey follows one person’s path through one product, from first visit to regular use. A customer journey is broader. It covers every interaction a person has with the brand over the whole relationship, including ads, sales calls, support tickets, billing and renewals. Product and growth teams usually own the user journey, while marketing and CX own the customer journey.
How do you track the user journey across anonymous and logged-in visits?
Track every visit from the first page view so anonymous activity is captured, then identify the user when they sign up or log in. In Statwide, calling identify() links the earlier anonymous events to the known user, and reset() on logout keeps shared devices separate. For B2B products, group users into accounts so the whole buying team shows up as one journey.
What is an example of a user journey?
A designer searches Google for a pitch deck template, lands on a Canva template page and leaves. A week later a retargeting ad brings them back, they sign up for a free trial, invite a teammate the next day and upgrade to a team plan a month later. That journey spans several visits and channels, and most of it happened before the designer was logged in.