Quick answer
Behavioral data is the record of what people do in a product or on a website: the pages they view, what they click, how far they scroll, which features they use and what they buy. Tools capture each action as an event. It matters because it shows what users actually do, which often differs from what they say in surveys.
Key takeaways
- Behavioral data shows actions. Surveys show opinions and intent. You need both, but decisions should be checked against behavior.
- Most of it falls into six types: navigation, interaction, session, feature usage, conversion and lifecycle.
- Start with 5 to 10 events that answer real questions, and keep personal data out of event properties.
Why is a channel that brought plenty of signups last quarter barely converting now? Is the customer journey this week the same one people took last month? Every marketer and product marketer asks some version of these questions, and the first step is usually to ask. You email a few customers, send a short survey or run a quick user test.
Ask new users how onboarding went and most will say it was fine. Then look at what they actually did. Statwide found a 78% drop between Signup and Activation across 42,381 sessions, and most of the people who left got stuck on the same screen: onboarding step 2, where the copy never made the value clear.
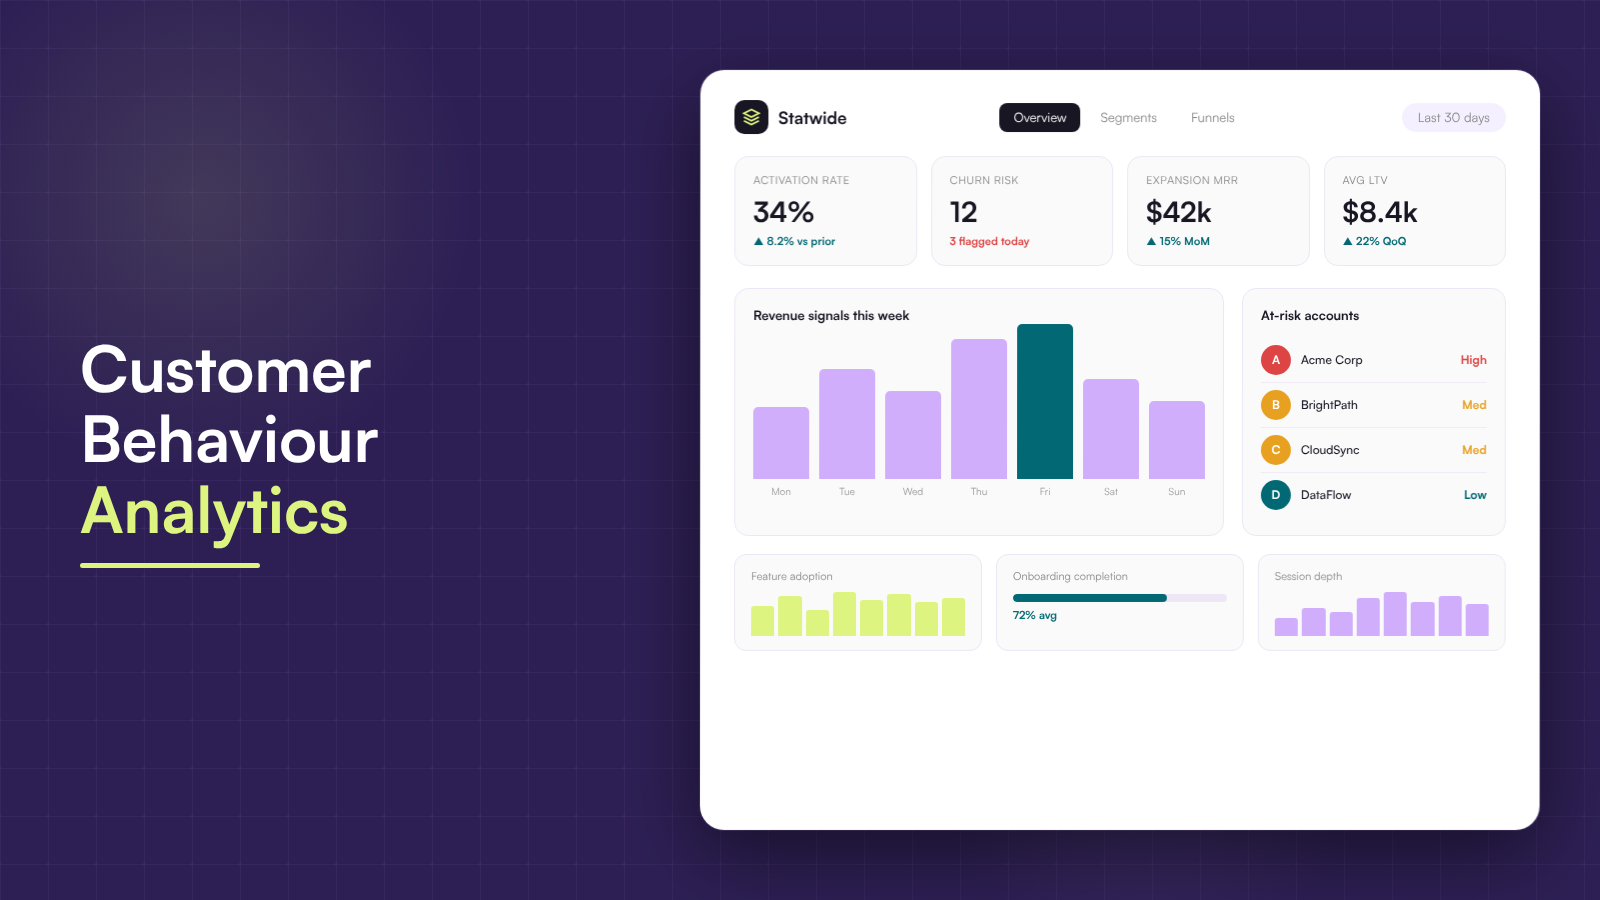
That gap between what people say and what they do is the whole case for behavioral data. It is the raw material behind behavioral analytics, and once you can read it, a lot of guesswork goes away.
In this guide you get more than a plain definition. You will see what behavioral data looks like in different kinds of products, from streaming apps and online stores to everyday work tools, how teams collect it, what to track first and how to handle it responsibly.
What is behavioral data?
Behavioral data is information about actions. Every time someone opens a page, clicks a button, scrolls, fills in a form, uses a feature or completes a purchase, that action can be recorded as an event. An event usually carries a name (like signed_up), a timestamp, who did it and a few properties that add context, such as the plan, the device or the page.
String those events together for one person and you get a clickstream, the path they took through your site or product, in order. Put thousands of clickstreams side by side and patterns show up: the screen where most users stall, or the feature people use right before they upgrade.
Behavioral data sits next to two other kinds of customer data. Declared data is what people tell you directly, in surveys, forms or interviews. Demographic and firmographic data describe who someone is: age and location for a person, company size and industry for a business account. Each one answers a different question, and only behavioral data shows what actually happened.
| Data type | What it captures | Example | How you get it | What it tells you |
|---|---|---|---|---|
| Behavioral This guide | Actions people take | Clicked Export report three times this week | Event tracking and autocapture | What users actually do |
| Declared | What people say | Rated onboarding 9 out of 10 | Surveys, forms and interviews | What users think or intend |
| Demographic and firmographic | Who someone is | Marketing manager at a 200 person software company | Signup forms, CRM and enrichment | Who your users are |
Events and attributes
Two building blocks hold all of this. An event is something a person did at a moment in time, like signed_up, report_exported or order_completed. An attribute describes the person or account doing it and stays the same until it changes, like job title, country, company size or plan.
| Building block | Event | Attribute |
|---|---|---|
| Describes | An action at a moment in time | Who someone is |
| How often it changes | A new one each time the action happens | Only when the fact changes |
| Example | order_completed with an order value of $49 | Plan: Pro, country: India, company size: 200 |
| Usually holds | Behavioral data | Demographic, firmographic and declared data |
That split maps neatly onto the three data types. What people do is almost always an event. Who they are, the demographic and firmographic side, lives in attributes. What people declare usually ends up as an attribute too: when someone picks Marketing as their role at signup or answers a survey question, the answer is saved on their profile.
Events carry their own details as properties. In Statwide, each custom event can include typed properties (text, numbers, true or false values, dates and lists), so order_completed can hold the order value and currency, and report_exported can hold the file format.
People often use behavioral data and behavioral analytics as if they mean the same thing. The data is the record of actions. Behavioral analytics is the practice of studying that record to explain and predict what users do.
What users say vs what they do
Surveys and interviews are good at telling you what people think, want and plan to do. They are weaker at predicting what people will do, because answers come from memory, describe good intentions and skip the boring parts. Someone can rate your onboarding 9 out of 10 and never come back after day two.
What people see on screen changes what they do, too. Every UI is different, and two audiences can react to the same screen in opposite ways. For one group a red button gets more clicks, for another a blue one does. Your team will have opinions about which works, and so will every stakeholder in the room. Only behavioral data can settle it for your audience: show both versions, watch what your users actually click and keep the winner.
Behavior fills that gap. It records the action itself, so nobody has to remember or report it. When a user says they love a feature but opens it once a month, the second fact is the one to plan around.
Research still matters. The two work best as a pair:
- Use behavioral data to find what is happening: where users drop, which features stick, which accounts go quiet.
- Use surveys and interviews to learn why: the confusion, missing context or competing priority behind the pattern.
- Before a big decision, check what people told you against what they did.
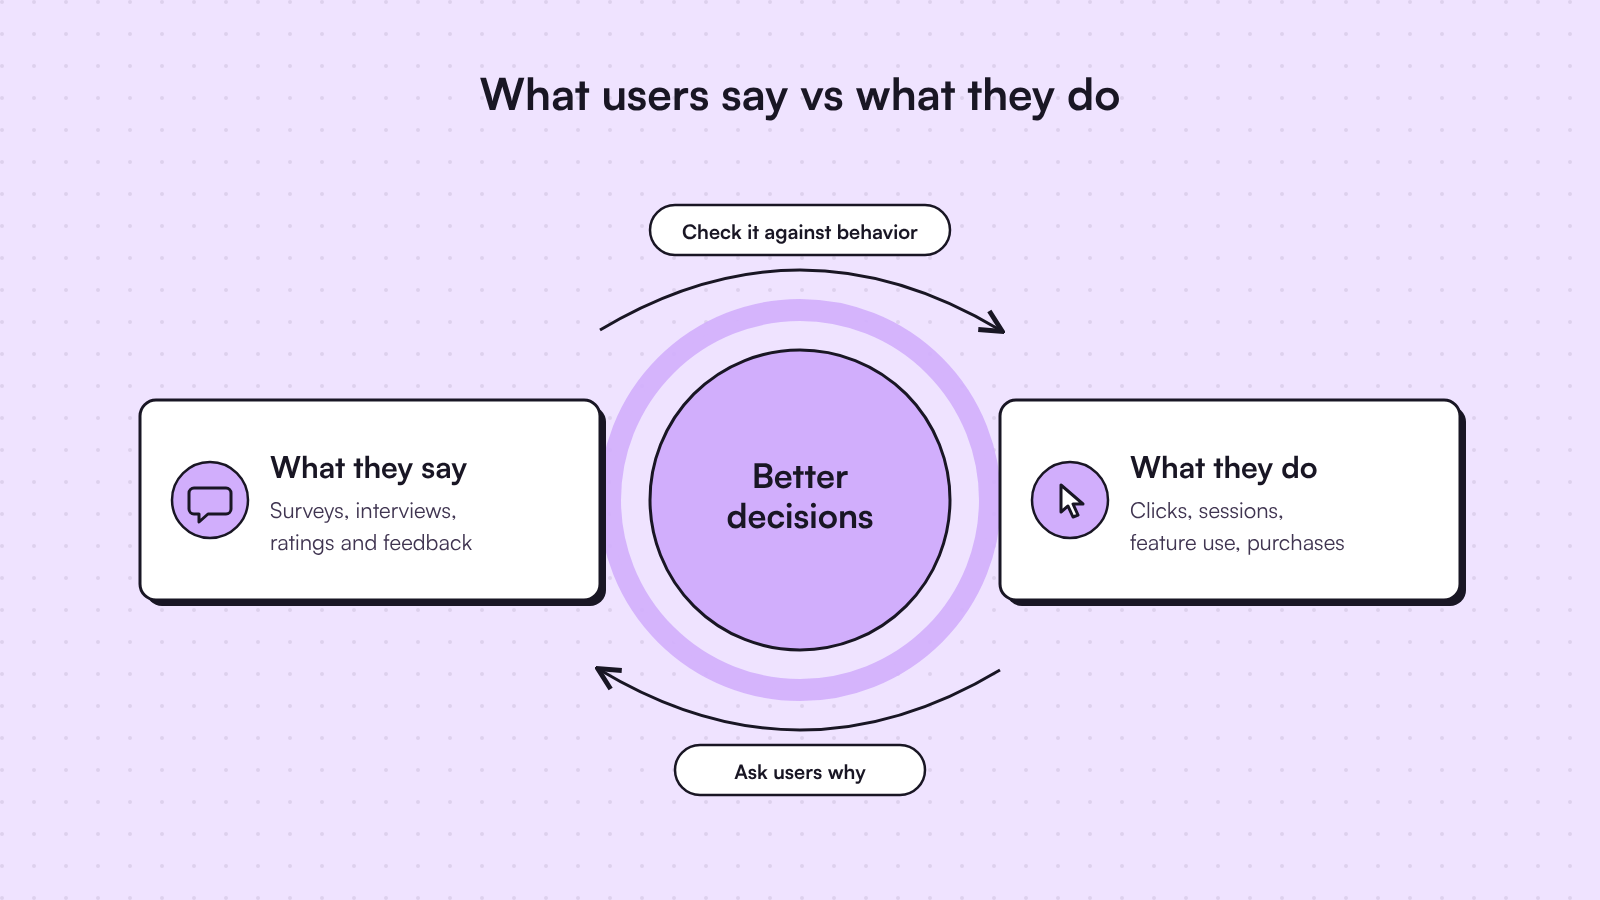
This is easier when both live in the same place. In Statwide, Surveys run inside the product alongside Events, so the answer and the action sit next to each other instead of in two tools that never meet.

Types of behavioral data (with examples)
Most behavioral data falls into six groups. The examples come from streaming apps, online stores and work tools, because the same types show up in almost every product.
Navigation data
Page views, the order people move through pages and how far they scroll. Example: a pricing page gets plenty of views, but most visitors never scroll down to the plan comparison, so the team moves the comparison higher.
Interaction data
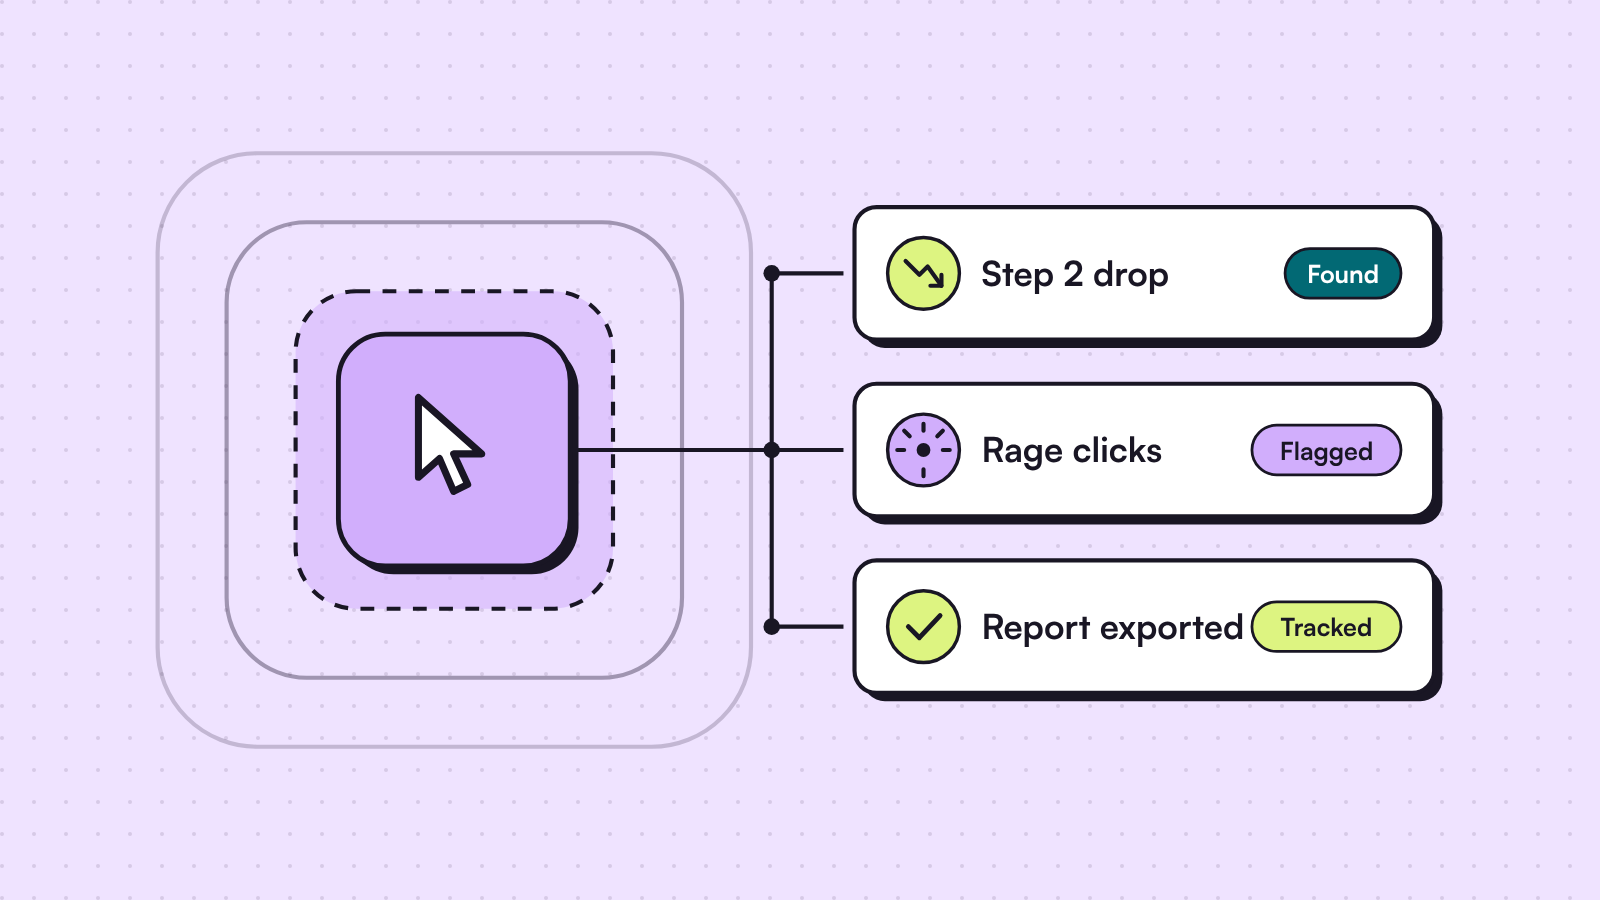
Clicks, taps, and form fields started or abandoned, plus two frustration signals. Rage clicks are repeated clicks on the same spot, usually on something that looks clickable and isn’t. Dead clicks get no response at all. Example: shoppers rage click a product photo that doesn’t zoom. Heatmaps show both on the page where they happen.
Session data
How long a visit lasts, how many pages or screens it covers and what happened in between. Session Recordings replay real visits so you can see where someone hesitated. Example: replays of users who abandoned a settings page show them hunting for a toggle that sits below the fold.
Feature usage data
Which features people use inside the product, how often and how deeply. Example: in a project management tool, the share of workspaces still using recurring tasks after week one tells the product team whether the feature earned its spot.
Conversion and transaction data
The moments that create value: completing checkout, starting a trial, upgrading a plan, renewing. These events often carry revenue properties. Example: an online store tracks order_completed with the order value, so revenue reports come from behavior instead of a separate spreadsheet.
Lifecycle and identity data
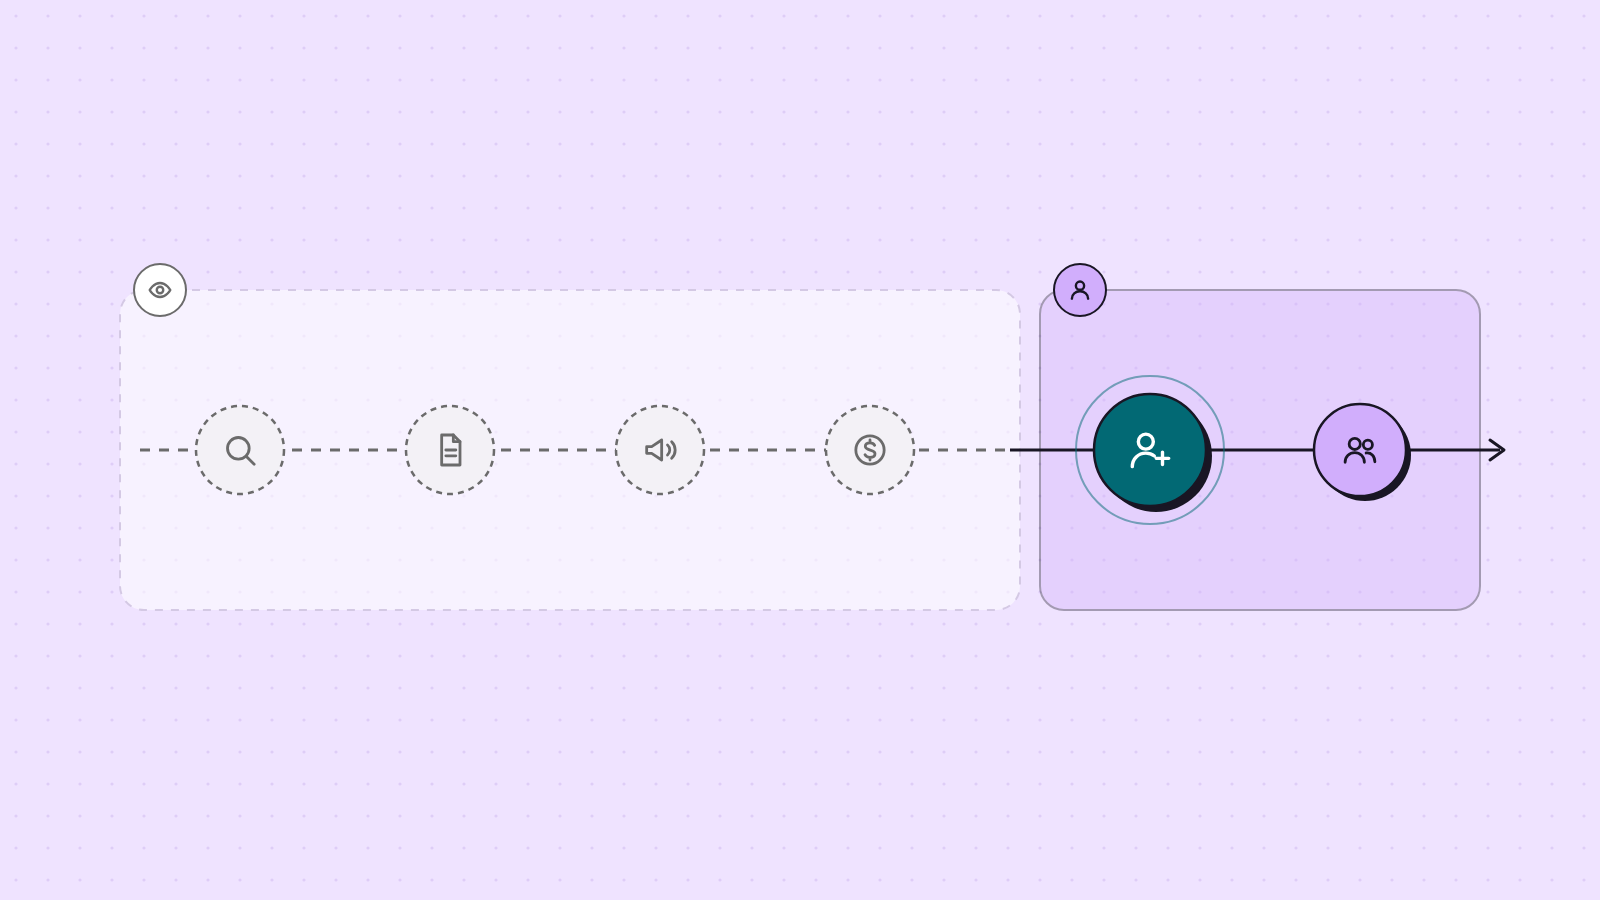
Signup, login, logout and the link between an anonymous visitor and a known user. Example: a visitor reads three blog posts and then signs up. Identity resolution ties those earlier visits to the new account, so marketing can see which content brought them in.
Here is the quick version:
| Type | What it includes | Quick example |
|---|---|---|
| Navigation | Page views, page order, scroll depth | Most visitors never reach the plan comparison |
| Interaction | Clicks, taps, form use, rage and dead clicks | Shoppers rage click a photo that doesn’t zoom |
| Session | Visit length, pages per visit, recordings | A replay shows a user hunting for a hidden toggle |
| Feature usage | Which features get used and how often | Few workspaces still use recurring tasks after week one |
| Conversion and transaction | Checkout, trial start, upgrade, renewal | order_completed with the order value |
| Lifecycle and identity | Signup, login, anonymous to known | A blog reader signs up and their earlier visits join their profile |

How behavioral data is collected
Teams collect behavioral data in four common ways, and most end up using more than one.
| Method | What it captures | Effort | Best for |
|---|---|---|---|
| Autocapture | Page views and clicks, recorded automatically | Low: install a snippet | Fast coverage from day one |
| No-code labeling | Names for specific buttons and elements | Low: point and click | Turning raw clicks into named actions |
| Custom events | Important moments with typed properties | Medium: one line of code per event | Stable tracking of what matters most |
| Server-side events | Outcomes confirmed by your backend | Medium: developer work | Payments, orders and anything that can fail |
Autocapture is instant, but it depends on your page layout, so a redesign can break it without warning. Custom events take a little more work and stay stable because you name them yourself. The usual path is to start broad with autocapture, then turn the moments that matter into custom events.
Identity ties it all together. When someone logs in, an identify call links their earlier anonymous activity to their account, so one person’s history doesn’t split in two. For a closer look at what to record at each step, see our guide to user activity tracking.
Statwide covers all four methods in one platform. It captures page views and clicks automatically, Label Events lets you name elements by pointing at them, and a single track call sends a custom event with typed properties from the browser or your server (through the Node SDK or the HTTP API). Here is how custom events work in Statwide.

Track less, learn more
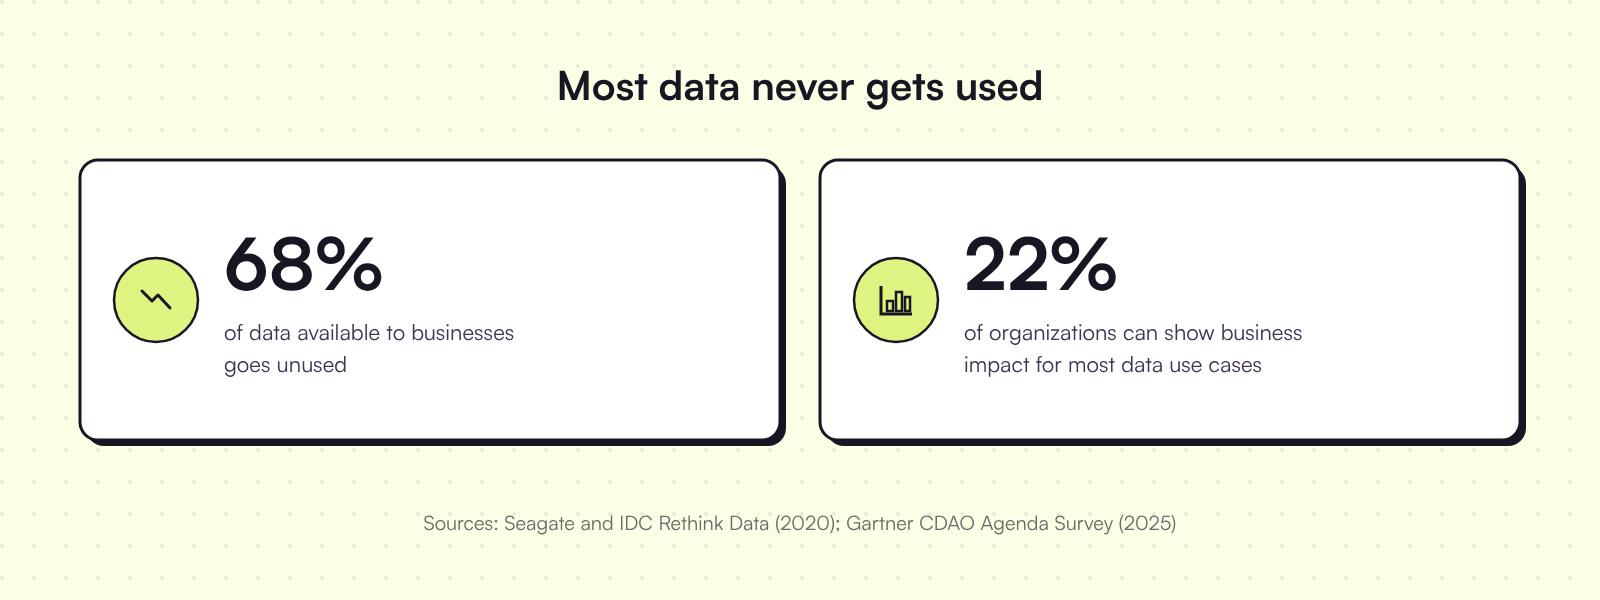
Collecting behavioral data is the easy part. Using it is where most teams fall short. In a 2020 IDC survey for Seagate, businesses said only 32% of the data available to them was put to work. A 2025 Gartner survey found that only 22% of organizations had defined, tracked and communicated business impact metrics for most of their data and analytics use cases.
There are two ways out, and they work well together.
The first is to track fewer things, better. Every event should answer a question someone on your team will actually ask. Total pageviews and raw signup counts look good in a report but rarely change a decision, which makes them vanity metrics unless you tie them to activation or revenue. Messy tracking also costs money: Gartner puts the average cost of poor data quality at $12.9 million a year per organization (2020 research). A short tracking plan before you instrument saves a painful cleanup later.
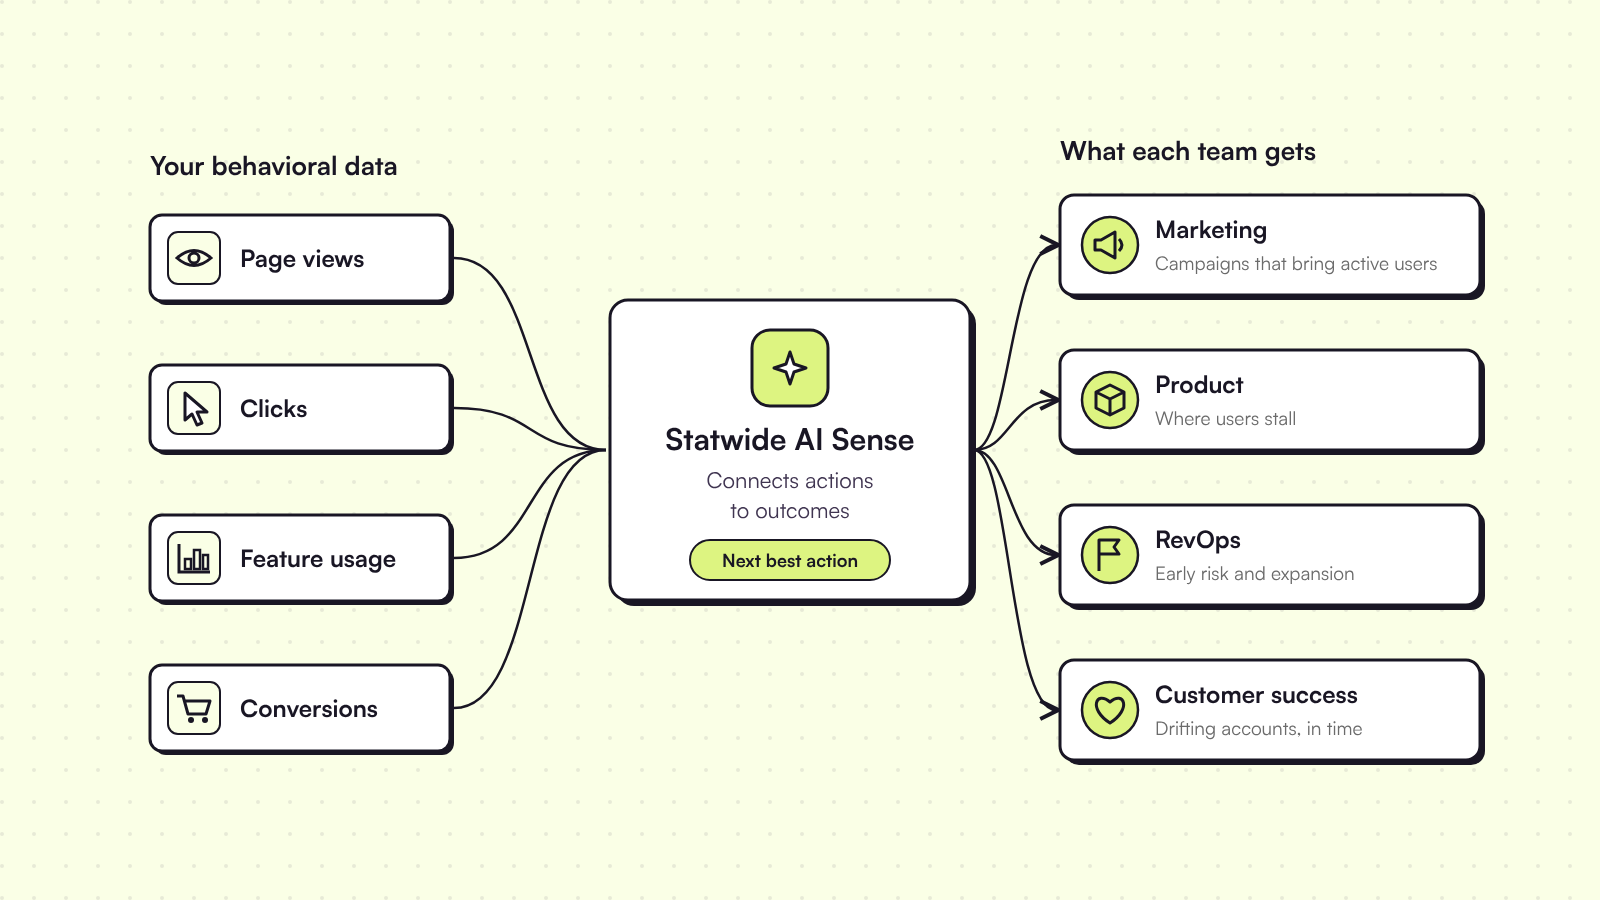
The second is to let AI read what you already collect. Statwide’s AI Sense looks across your existing events, connects them to outcomes like activation, churn and expansion, and recommends the next best action, so the events nobody looks at start pulling their weight.
What to track first
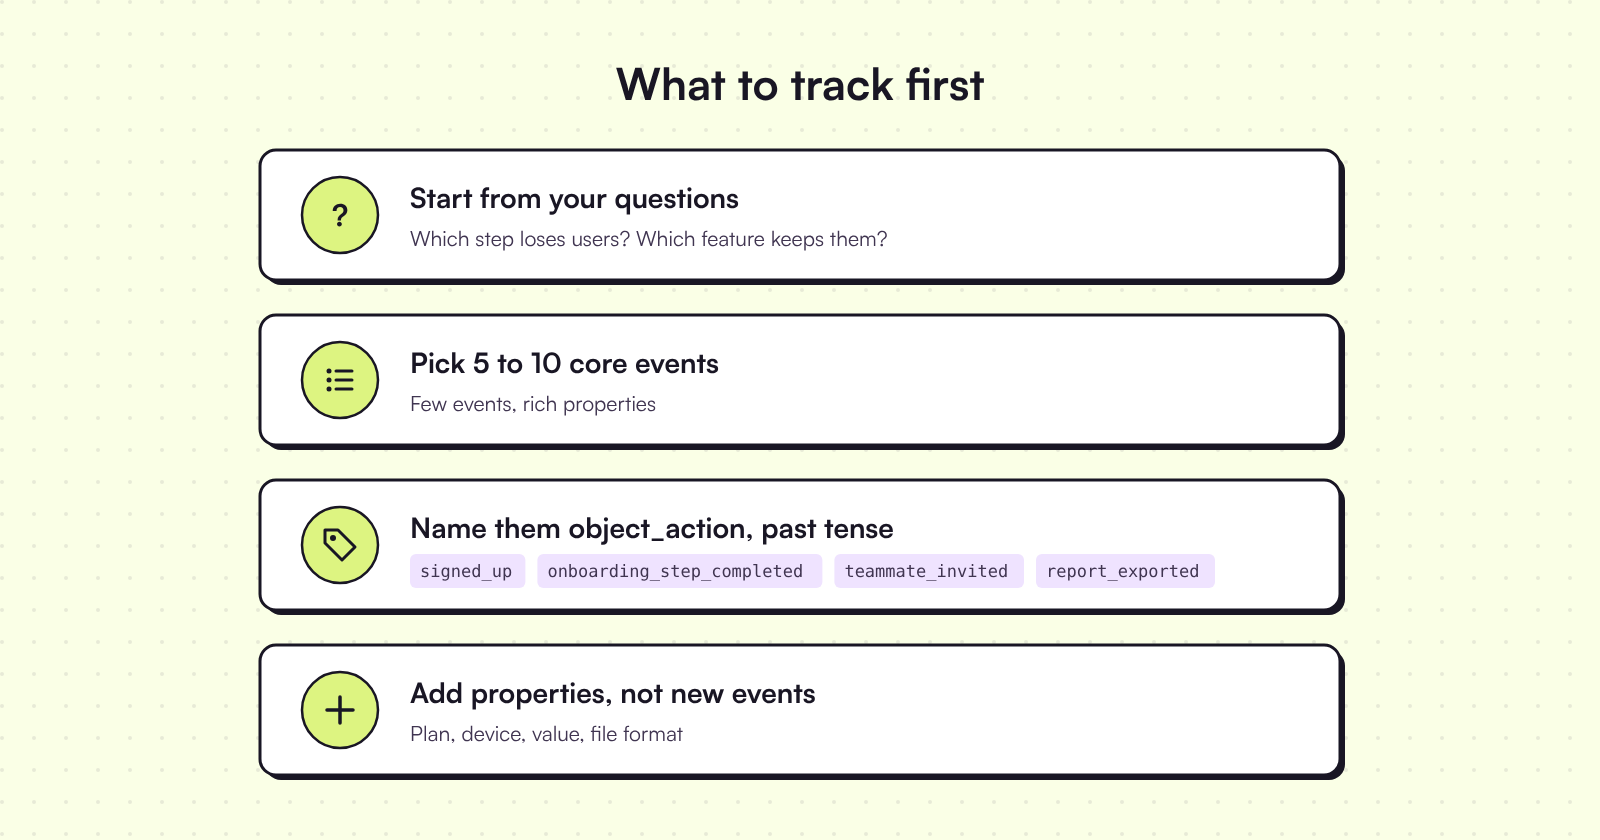
If you are starting from zero, keep it this small:
Why every team needs behavioral data
Any team that owns part of the customer journey can use behavioral data. Each one reads it differently:
- Marketing sees which campaigns bring in users who go on to activate, and moves budget toward them.
- Product sees where users stall and which features keep them coming back.
- RevOps sees early risk and expansion signals, like a drop in active seats or usage climbing toward a plan limit.
- Customer success sees which accounts are drifting while there is still time to help.
Most of this work starts with grouping users by what they do. Our guide to user behavior segmentation walks through how.
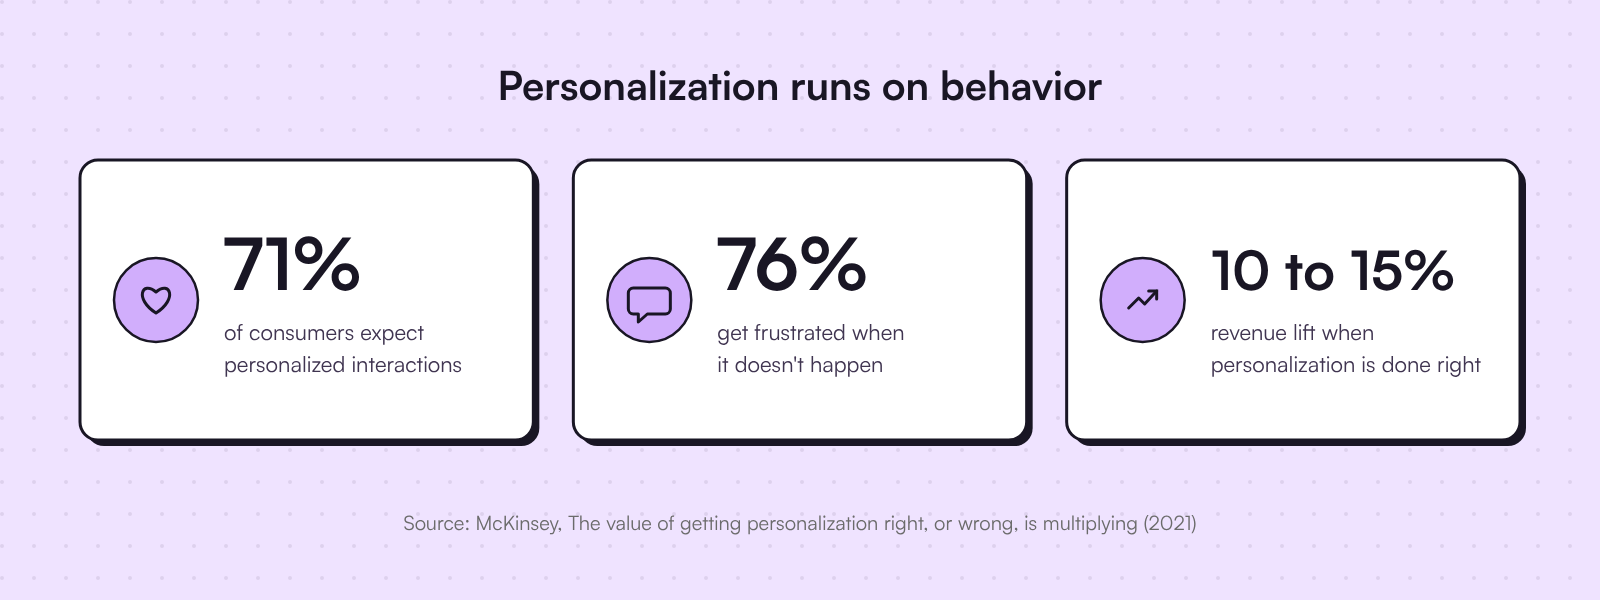
Personalization is where behavioral data pays off most visibly, and Netflix shows how far it can go. Beyond choosing which titles you see, it also chooses the artwork. In its artwork personalization write-up, Netflix’s engineers explain that a member who watches a lot of romance may see Good Will Hunting with Matt Damon and Minnie Driver on the thumbnail, while a comedy fan sees Robin Williams. A Pulp Fiction thumbnail can feature Uma Thurman or John Travolta, depending on whose movies you tend to watch. The picture is picked from your viewing behavior to make you more likely to press play.
The payoff is easy to measure, too, as McKinsey’s 2021 personalization research shows:
To act on it, build Cohorts from behavior and send them where your teams already work. Cohorts can sync to HubSpot, Slack or a webhook, so the CS lead gets the list of drifting accounts in Slack and marketing gets the activated trial users in HubSpot.

Behavioral data, privacy and trust
Once events are tied to a person or an account, privacy laws such as GDPR can treat them as personal data, so handle them that way from day one.
In-product behavior is first-party data: people create it while using your product, and you collect it directly. Consumers are more relaxed about that. In Twilio Segment’s 2022 research, 63% of consumers said they were fine with personalization when brands use their own data rather than data bought from third parties. Only 40% trusted brands to use their data responsibly, so the trust still has to be earned.
Four rules keep you on the right side of it:
- Keep emails, names and IDs out of event properties. Statwide refuses property keys that look like IDs or emails.
- Collect only what answers a question you actually have.
- Tell users what you track and why, in plain language.
- Honor data rights. When a user asks you to delete their data under GDPR or a similar law, delete it everywhere, analytics included.
Third-party cookies are a shaky base for any of this. Google has kept third-party cookies in Chrome with its current approach, so they still work, but they depend on browser settings you don’t control. Behavioral data from your own product doesn’t.
Turn behavioral data into answers with Statwide
The gap between what users say and what they do closes when behavior, feedback and analysis live in one place. Statwide brings web analytics, product analytics and AI Sense together as one customer intelligence platform. Events and Session Recordings show what users do, Surveys capture why, and AI Sense points to the next best action. In one Statwide case study, activation rose from 12% to 28%.
Start with the 5 to 10 events that answer your biggest question. Then get started with Statwide, or book a demo to see what your own behavioral data is telling you.
Frequently asked questions
What is an example of behavioral data?
A user clicking Export report, a shopper adding a jacket to their cart, a visitor scrolling halfway down a pricing page and a customer upgrading their plan are all behavioral data. Each is an action recorded as an event, usually with a timestamp and details such as the page, device or plan. Together they show what people actually do in a product or on a site.
How is behavioral data collected?
Most tools collect it four ways. Autocapture records page views and clicks once you install a snippet. No-code labeling names specific elements. Custom events send important moments through a short line of code, and server-side events confirm outcomes such as payments from your backend. Many teams start with autocapture and add custom events for the moments that matter most.
What is the difference between behavioral data and demographic data?
Demographic data describes who someone is, such as age, location or job title, and firmographic data does the same for companies. Behavioral data describes what someone does: the pages they visit, the features they use and what they buy. Demographics help you decide who to target, while behavior shows intent and engagement, so most teams combine both when they build segments.
Is behavioral data personal data?
It can be. Behavioral data tied to an identifiable person, through a login, an account or a device ID, generally counts as personal data under laws like GDPR. Treat it that way: keep emails and IDs out of event properties, collect only what you need, tell users what you track and delete their data when they ask.
What is the difference between behavioral data and behavioral analytics?
Behavioral data is the raw record of user actions, such as clicks, page views and feature use. Behavioral analytics is the practice of analyzing that record to find patterns, explain why users act the way they do and predict what they will do next. You need clean behavioral data before any analysis can be trusted.
How many events should you track first?
Start with 5 to 10 core events tied to the questions you need answered, such as signup, onboarding completion, first core action, teammate invite and upgrade. Use a few events with rich properties instead of many narrow ones, name them in object_action form like report_exported, and send outcomes that can fail, such as payments, from your server.