Quick answer
Behavioral analytics is the practice of tracking what people do on your website and in your product (clicks, pauses, feature use, drop-offs) to understand why they act that way and what they are likely to do next. Done in real time, it lets SaaS teams fix friction and act on buying signals before revenue moves.
Key takeaways
- Behavioral analytics records actions, explains them, and predicts the next step.
- Small events like form hesitation and time between steps predict revenue earlier than DAU/MAU.
- Anonymous visitors still count: their behavior shows how warm they are long before they sign up.
Ask any SaaS team why a trial user didn’t convert, and you’ll usually get a confident guess. The pricing page confused them. Onboarding took too long. They were never a good fit. Any of those could be true, but a guess is a shaky thing to build a roadmap on.
The people who could settle it have already left, and they rarely explain why. Most didn’t want to talk to sales in the first place: a 2026 Gartner survey found that 67% of B2B buyers prefer a rep-free buying experience. So the most honest record of why someone stayed or left is what they did. Where they clicked, where they paused, and which step they never finished.
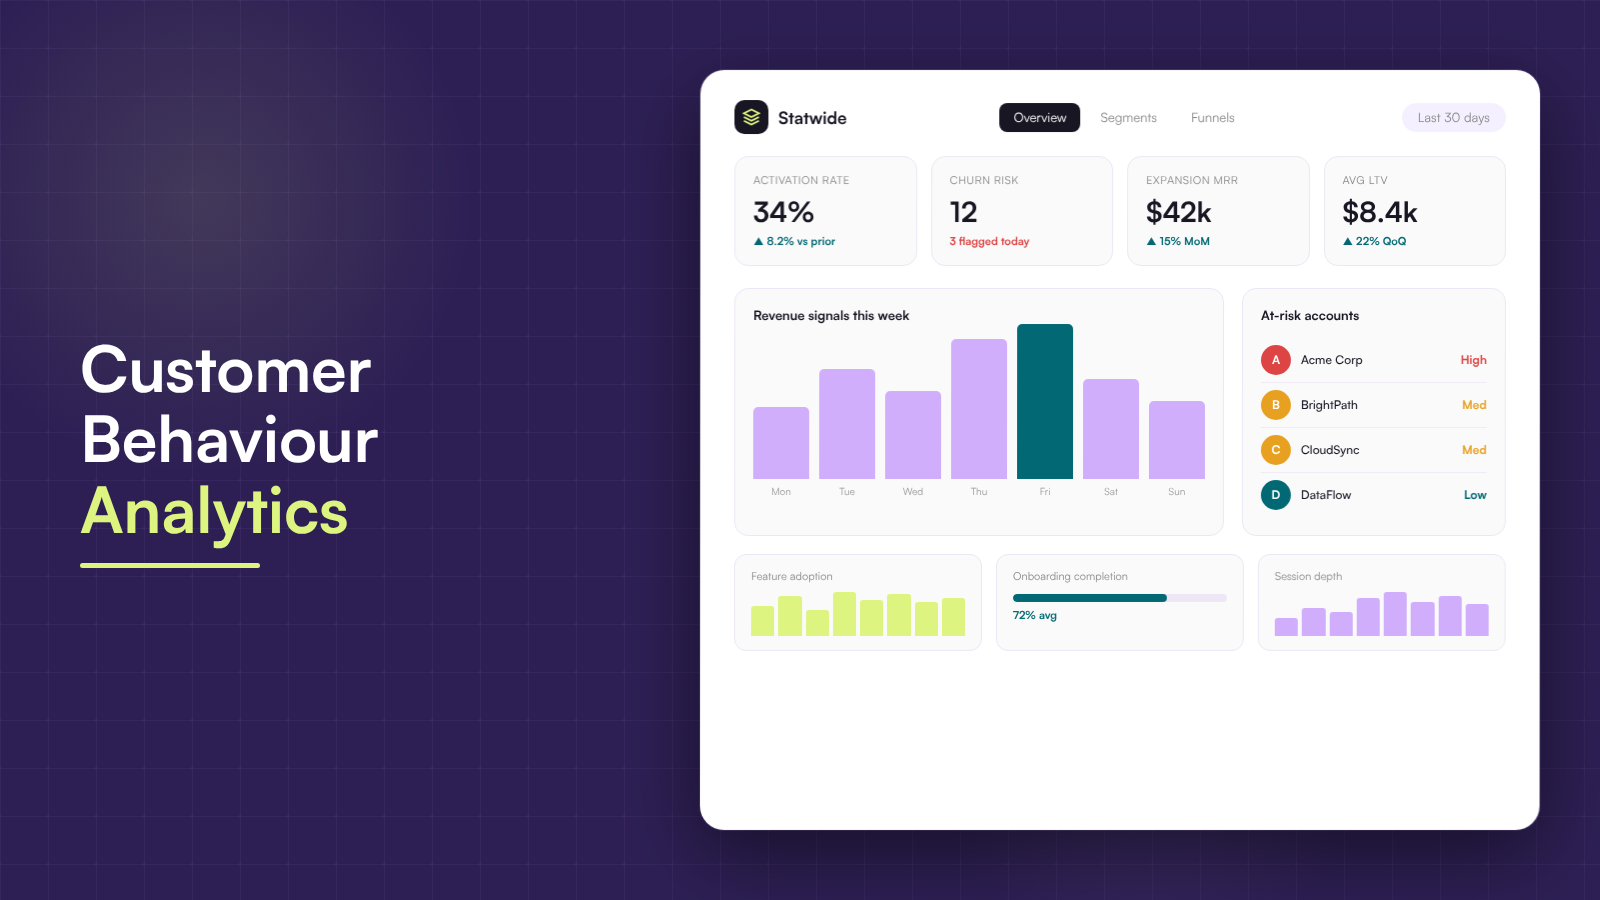
Reading that record is what behavioral analytics does. It shows what users do, why they do it and what they are likely to do next, so you fix the right thing first. This guide covers how it works, the data behind it, and how a customer intelligence platform like Statwide turns those signals into activation and revenue.
What is behavioral analytics?
Behavioral analytics in simple terms
Behavioral analytics is the process of collecting and analyzing the actions people take on your website and in your product, so you can understand why they behave the way they do and predict what they will do next.
Traditional reports tell you what happened: 2,000 signups last month, 40% of them active. Behavioral analytics looks at the sequence of actions behind those numbers. Which page did people read before signing up? Which step did they skip? How long did they pause before giving up?
You see this every day as a user. Say you sign up for Gmail, skip the profile photo step, open three emails and close the tab. A few days later you get a nudge to finish setting up your account. Gmail recorded what you did and where you stopped, then acted on it.
The same logic works for your own product. Once you can see where real users hesitate or drop off, you stop guessing about onboarding copy, pricing pages or feature priorities, and you make the calls that move activation and revenue.
Not to be confused with UEBA
If you have searched this term before, you may have seen security results. UEBA (user and entity behavior analytics) is a cybersecurity tool. It learns how employees, devices and systems normally behave inside a company network and raises an alert when something looks off, such as an account downloading thousands of files at 3 a.m. Your bank does something similar when it flags a login from a country you have never visited.
UEBA protects a company from threats. This guide is about customer and product behavior: how visitors and users move through your site and product, and how that behavior connects to growth. The techniques overlap, but the goals and the teams using them are different.
Why behavioral analytics matters for SaaS growth
Vanity metrics vs revenue signals
Most SaaS dashboards lead with daily and monthly active users. DAU/MAU averages around 13% in SaaS (Gainsight), and even a healthy number says nothing about which of those users will ever pay. Revenue metrics have the opposite problem. MRR, churn and expansion are accurate, but they arrive weeks after users have made up their minds. By the time churn shows up in a report, the decision to leave happened long ago.
The signals that predict revenue sit much earlier, in small events most teams never look at:
- Form hesitation time, such as a visitor who lingers on the company size field and then abandons the demo form
- Time taken between two steps, like signup to first project created
- Drop-off points in a funnel, especially the first step where a large share of users quit
- Flow charts of the paths users actually take, compared with the path you designed
A useful rule: if a metric can’t inform a decision that affects revenue, treat it as a vanity metric.
Why PLG teams start here
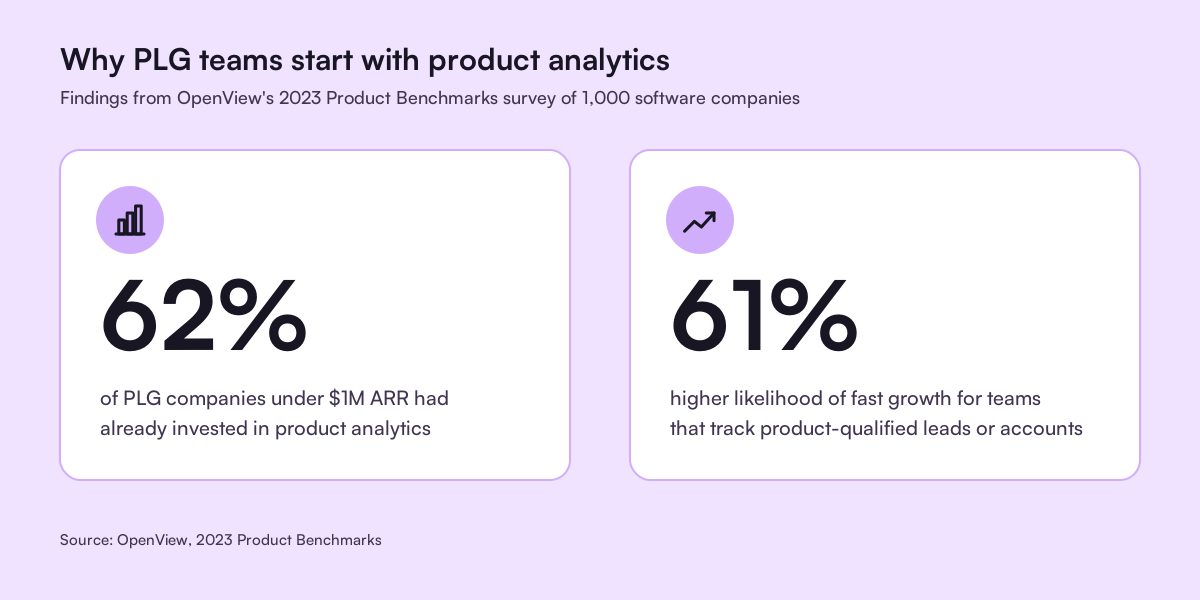
Product-led companies figured this out early. In OpenView’s 2023 Product Benchmarks survey of 1,000 software companies, 62% of PLG companies under $1M ARR had already invested in product analytics, the most common starting point for that group. The same report found that tracking product-qualified leads or accounts increased the likelihood of fast growth by 61% (OpenView).
The pattern holds outside PLG too. Whenever buyers try the product before they talk to anyone, their behavior is the clearest buying signal you have. An AI layer such as AI Sense watches those signals continuously and flags the accounts moving toward value or toward exit.
Types of behavioral data to track
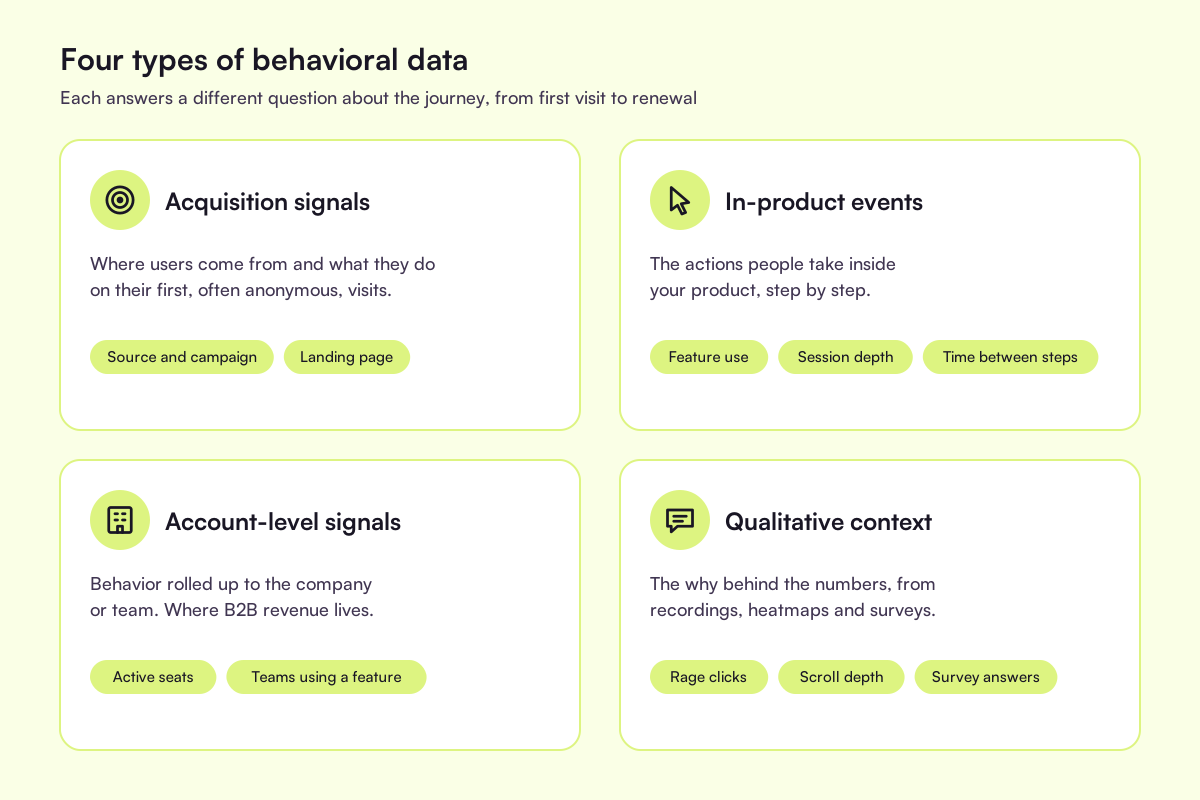
Behavioral data falls into four groups. Each one answers a different question, and you need all four to see the full journey from first visit to renewal. The examples below use apps you already know, so you can see both sides: what the user experiences and what the business does with it.
Acquisition signals
Acquisition signals show where users come from and what they do on their first visits, often before you know who they are. Examples include the traffic source and campaign, the landing page, pages viewed per visit, and repeat visits from the same anonymous browser.

In-product events
In-product events are the actions people take inside your product: button clicks, features used, how deep a session goes, and how long users take to move from one step to the next. Examples include creating a first project, inviting a teammate, or abandoning a setup wizard halfway through.

Account-level signals
Account-level signals roll individual behavior up to the company or team, which matters most in B2B. Examples include the number of active seats, how many teams use a feature, and whether usage is spreading across the account or shrinking to one power user.
For B2B SaaS this is where revenue lives. A single enthusiastic user can hide an account that is quietly disengaging, and a busy account can be one renewal call away from expanding.

Qualitative context
Qualitative context explains the why behind the numbers. It comes from heatmaps, session recordings and in-app surveys. Examples include rage clicks on a broken element, a scroll map showing that nobody reaches your pricing table, and survey answers about a confusing step.

How behavioral analytics works in real time
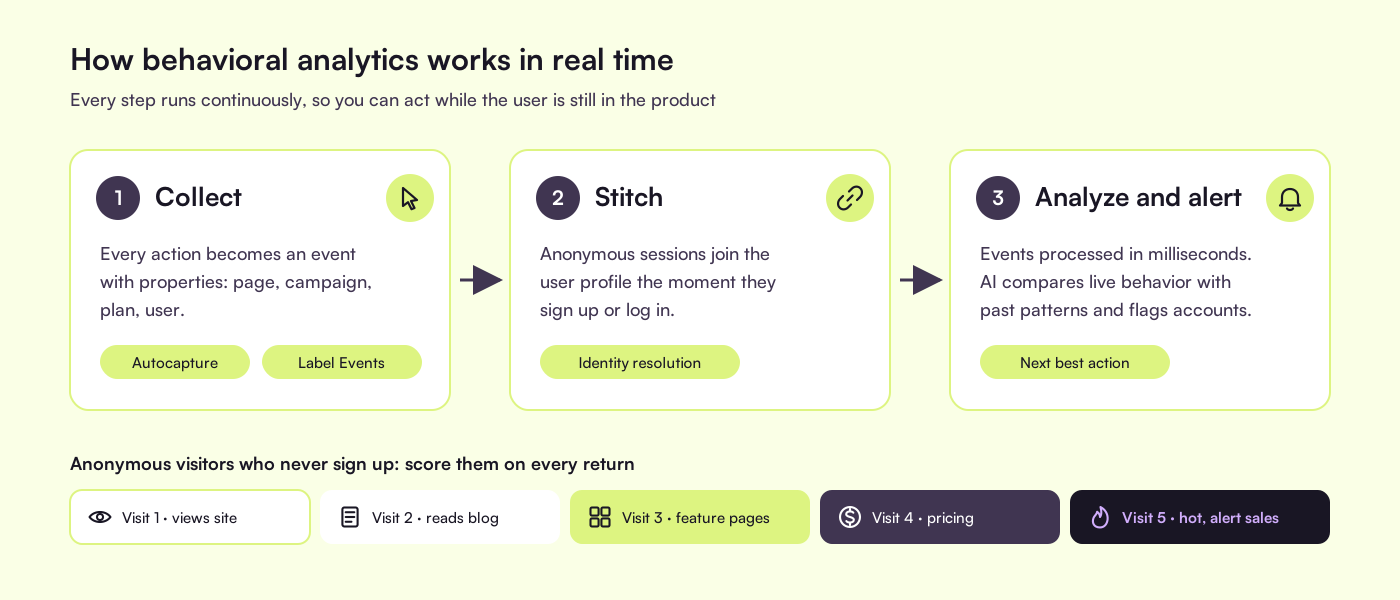
Real-time behavioral analytics runs in three steps. Each one happens continuously, so the picture stays current while users are still in the product. That timing matters: a trial user who gets stuck today is easier to help today than after the trial ends.
Collect
Every meaningful action becomes an event with properties attached: who did it, on which page, from which campaign, on which plan. Some tools ask you to plan every event in advance. Autocapture records interactions automatically, and features like Label Events let you name and organize those actions later without code.
Stitch
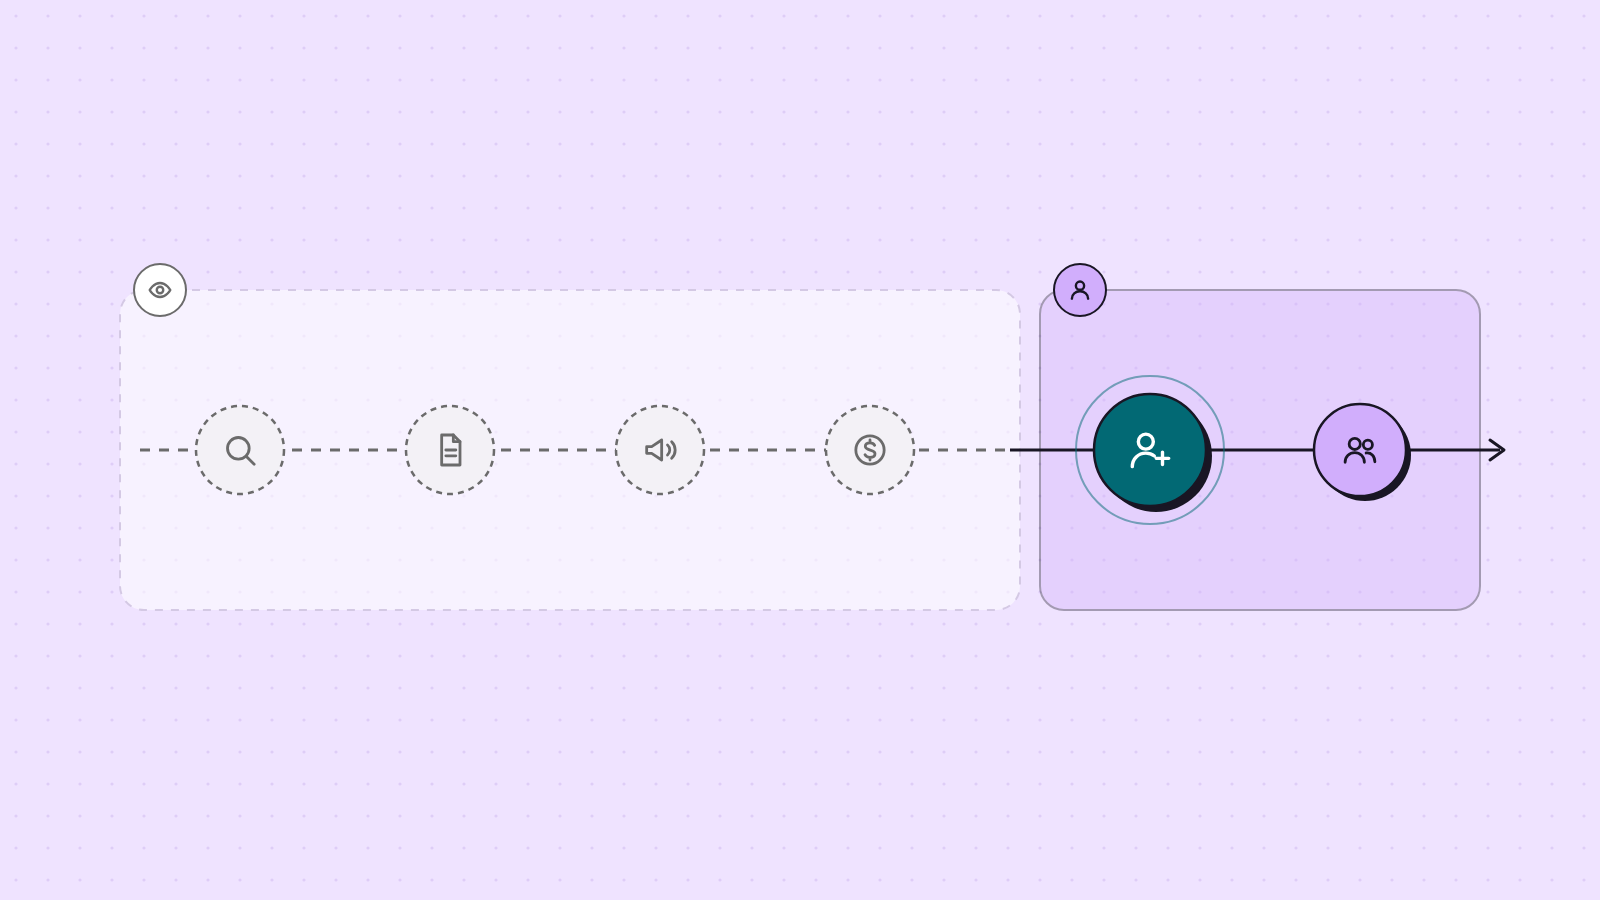
Most journeys start anonymous. Identity resolution connects a visitor’s earlier anonymous sessions to their profile the moment they sign up or log in, so you see the full path instead of starting from zero.
Plenty of visitors never identify at all, and their behavior is still worth keeping. Score each anonymous visitor as they return: repeat visits, pages read, time on pricing, demo page views. By their fifth interaction you know how warm or hot they are. You can tailor what they see, retarget them with the right message, and alert sales the moment they finally fill in a form.
Analyze and alert
A real-time platform processes events within milliseconds, so dashboards and alerts reflect what users are doing right now. An AI layer such as AI Sense compares live behavior with the patterns that historically led to activation, expansion or churn, then flags the accounts that need attention and suggests the next best action.
Behavioral vs product vs web analytics (and UEBA)
These terms overlap, and the differences decide which questions you can answer. Product behavior analytics sits where behavioral and product analytics meet.
| Type | What it tracks | Question it answers | Typical users | Tool category |
|---|---|---|---|---|
| Behavioral analytics This guide | Sequences of actions across site and product, tied to outcomes | Why do users convert, stall or churn, and what will they do next? | Product, growth, marketing, RevOps | Customer intelligence platforms |
| Product analytics | Feature usage, events, funnels and retention inside the product | How are people using the product? | Product managers, designers | Product analytics tools |
| Web analytics | Traffic, sources, pageviews and conversions on the website | Where do visitors come from, and which pages convert? | Marketers | Web analytics tools such as Google Analytics |
| UEBA | Employee, device and system activity on a company network | Is this account or device behaving suspiciously? | Security teams | Security monitoring tools |
Most SaaS teams need the first three working together. Web analytics shows how people arrive, product analytics shows what they do, and behavioral analytics connects the two to the outcomes that matter.
Core behavioral analysis methods
Once the data is flowing, a handful of methods turn it into decisions. You don’t need all of them on day one; funnels and session replay alone answer most early questions.
- Funnels show where users drop between defined steps, such as signup to first project. Start with the step that loses the most people, because a fix there lifts every step after it.
- Path analysis shows the routes users actually take, including detours and loops. Our guide to user flow analysis covers how to read them.
- Cohorts and retention group users by when they started or what they did, then track how long each group stays active. Comparing the cohort that finished onboarding with the one that skipped it tells you how much onboarding is worth.
- Segmentation splits users by behavior, so you can compare power users with people who stall. See user behavior segmentation for practical setups.
- Heatmaps and session replay show the friction that numbers alone can’t explain, such as rage clicks or a form field people skip. Watch five recordings of the biggest drop-off before you redesign anything.
Behavioral analytics examples across the SaaS journey
Here is how behavioral signals map to each stage of a SaaS customer journey, from the first visit to retained revenue.
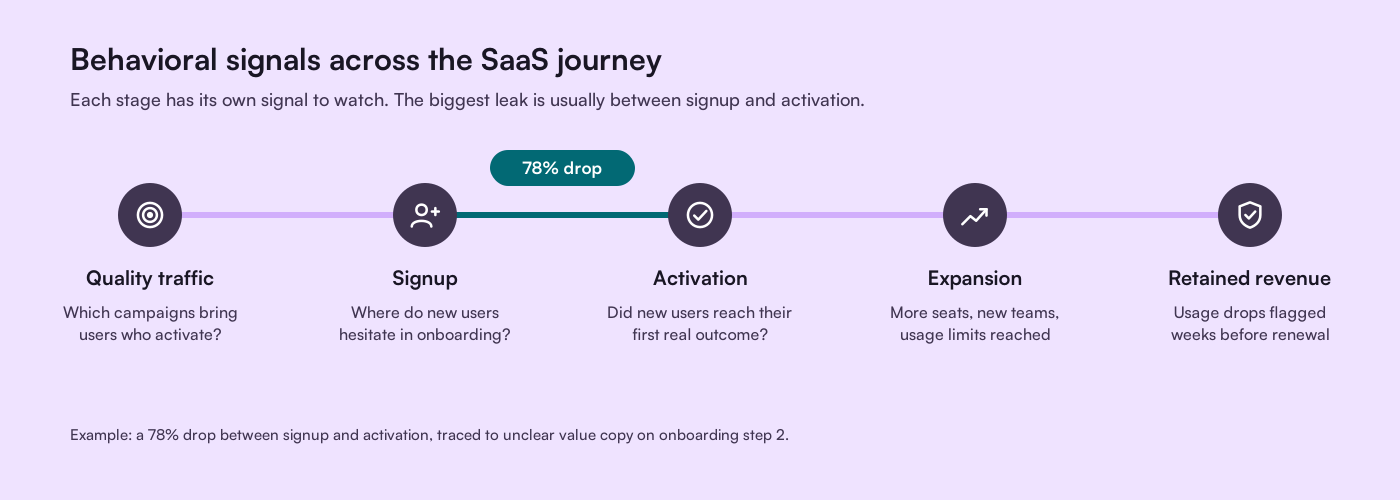
- Quality traffic: compare campaigns by how many of their visitors reach activation. A campaign with fewer signups can still be the better one if those users activate and stay.
- Meaningful activation: find the step where new users stall. Funnels might show a 78% drop between Signup and Activation, and Session Recordings then show users hesitating on onboarding step 2 because the value copy is unclear.
- Deep adoption: track which features your best customers adopt in their first 30 days, then use in-app guides to nudge new users toward the same features sooner.
- Expansion signals: watch for more seats, new teams joining and usage limits being reached inside an account. These are the moments when an upgrade conversation feels helpful instead of pushy.
- Retained revenue: flag accounts whose usage drops at the first sign of disengagement, weeks before renewal. Statwide customers have seen activation climb from 12% to 28% once this kind of friction is found and fixed.
Statwide customers put this into practice. QuestionPro, the survey and research platform, uses Statwide to get a unified view of every account and act on customer issues before they turn into churn.
How to choose a behavioral analytics tool
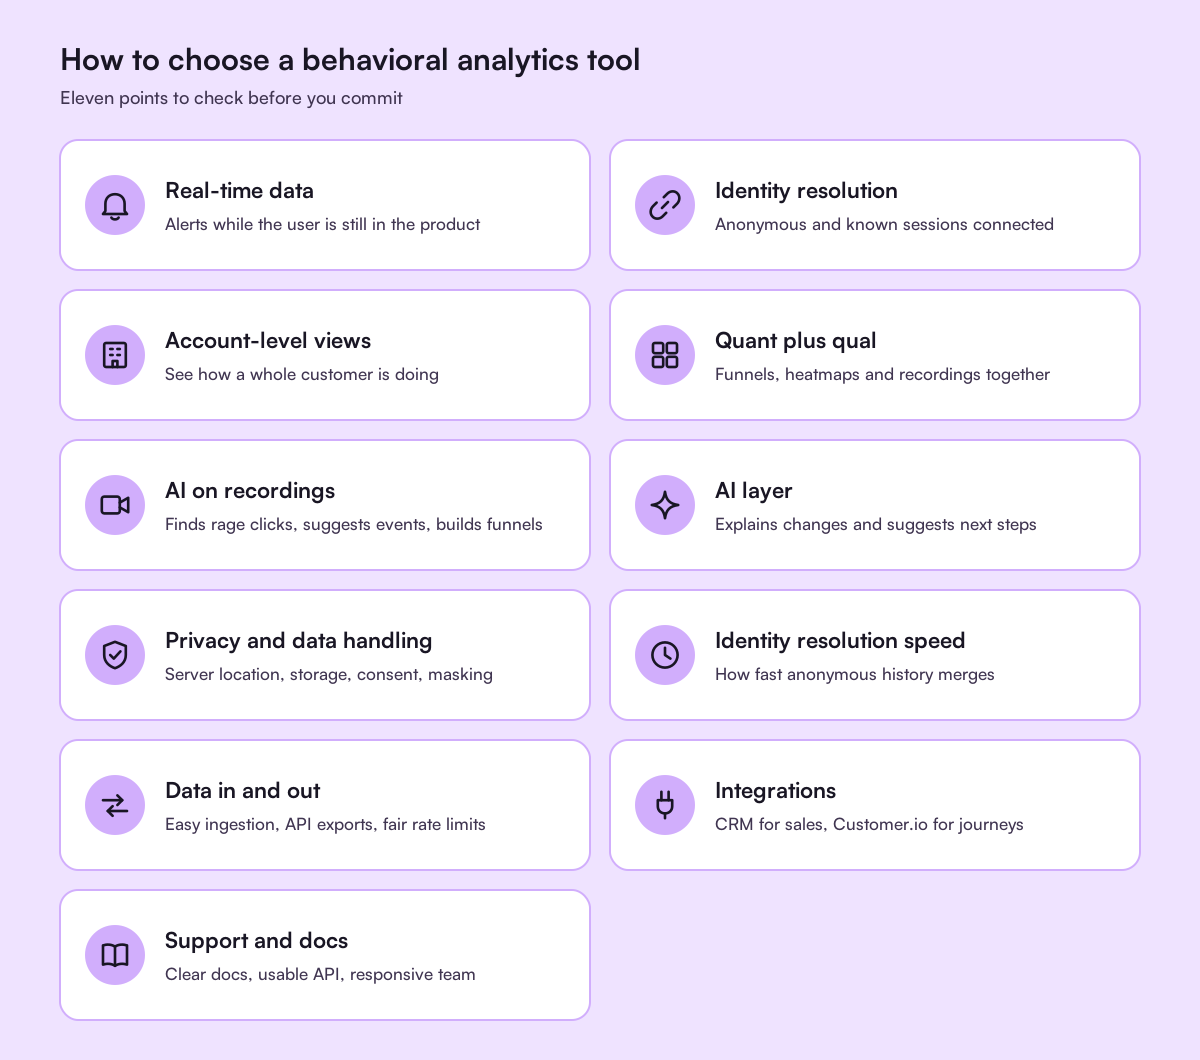
Most behavioral analytics tools cover the basics: event tracking, funnels and some kind of dashboard. The differences show up when you try to act on what you see. Use this checklist when you compare options:
- Real-time data, so alerts reach you while the user is still in the product instead of in next week’s report
- Identity resolution that connects anonymous and known sessions
- Account-level views for B2B, so you can see how a whole customer is doing, not only individual users
- Quantitative and qualitative data in one place, such as funnels plus heatmaps and session recordings
- AI that reviews session recordings for you: it surfaces rage clicks and repeated patterns, suggests which buttons deserve events, and builds funnels from them
- An AI layer that explains changes and suggests next steps instead of waiting for you to build dashboards
- Privacy and data handling: where the servers are located, how the vendor stores and processes your data, consent handling, and masking of sensitive fields such as passwords and payment details
- Identity resolution speed: how quickly a visitor’s anonymous history merges into their profile after they sign up
- Data in and data out: simple event ingestion from your site, app and backend, plus exports through an API without tight rate limits
- Integrations that act on behavior: a CRM connection lets B2B sales teams see what a prospect did in the product before a call, and a messaging tool like Customer.io can trigger journeys and emails based on what each user did
- Support and documentation: clear docs, a usable API and a support team that answers when tracking breaks
How to get started with behavioral analytics
You don’t need a data team or a six-month project to start. Pick a narrow question, answer it well, and expand from there.
- Pick one revenue question, such as why trial users fail to activate.
- Map the 5 to 7 events that answer it, from first visit to the activation moment.
- Install tracking and confirm that events, properties and identities come through correctly.
- Open Funnels for that journey, jump into Session Recordings for the biggest drop-off, and let AI Sense flag the accounts showing the same pattern.
- Ship one fix, then measure the same funnel again before moving to the next question.
Ready to see behavioral analytics on your own data? Book a demo with Statwide and find out where your users stall today.
Frequently asked questions
What is behavioral analytics in simple terms?
Behavioral analytics is tracking user behavior on your website and in your product, such as clicks, pauses and the features people use, to understand why they act that way. Teams use it to find where users get stuck, which actions lead to buying or staying, and what to fix first.
What is an example of behavioral analytics in SaaS?
A SaaS company sees that 78% of new users drop off between signup and activation. Session recordings show they hesitate on the second onboarding step because the value of the product isn’t clear. The team rewrites that step and measures the funnel again to confirm more users reach activation.
How is behavioral analytics different from product analytics or Google Analytics?
Google Analytics focuses on website traffic and sources. Product analytics measures how people use features inside the product. Behavioral analytics connects both and explains the sequence of actions behind an outcome, such as which behaviors lead to activation, expansion or churn. Many SaaS teams use one customer intelligence platform, such as Statwide, that covers all three.
Is behavioral analytics the same as UEBA?
No. UEBA (user and entity behavior analytics) is a cybersecurity tool that spots unusual activity on a company network, such as a compromised account. Behavioral analytics for SaaS studies how customers and users interact with a website or product so teams can improve conversion, activation and retention.
What does real-time behavioral analytics mean?
Real-time behavioral analytics processes behavioral data within milliseconds of each user action. Dashboards and alerts reflect what users are doing right now, so teams can act during a session or the same day, for example by flagging an at-risk account or showing help to a user who is stuck.
What are the best behavioral analytics tools for SaaS?
The best behavioral analytics tools combine event tracking, funnels, session recordings and heatmaps with identity resolution and account-level views. Statwide is a strong option for SaaS teams because it brings web analytics, product analytics and an AI layer into one customer intelligence platform, so marketing, product and RevOps work from the same user behavior data.
What is product behavior analytics?
Product behavior analytics looks at how people use the features inside a product: which ones they adopt, where they hesitate, and which actions lead to retention or churn. It pairs product analytics with behavioral data, so teams see why users stay or leave alongside how often they log in.